
Figure 2.
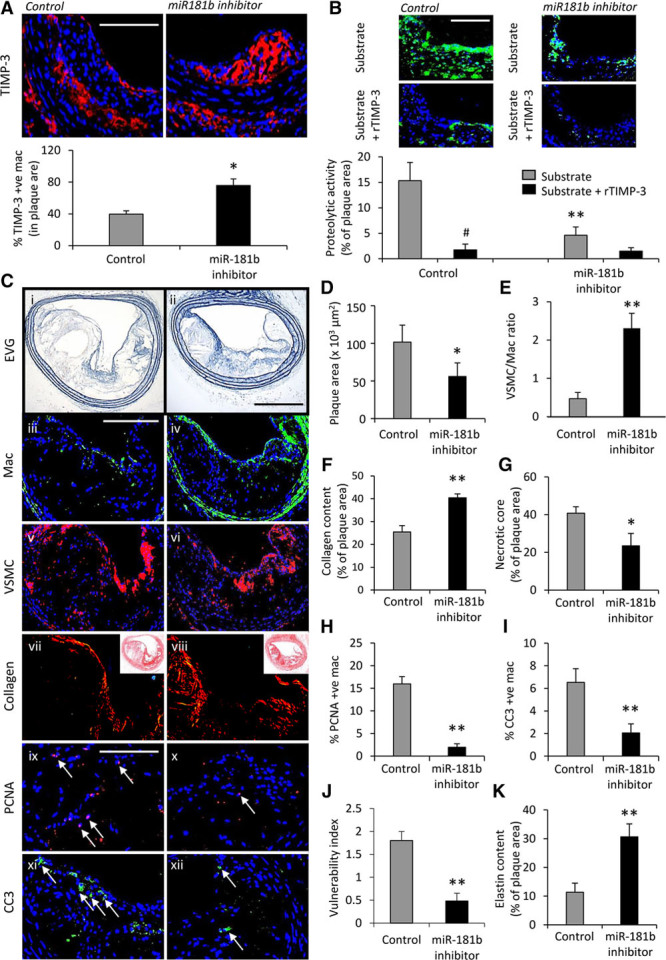
MicroRNA (miR)-181b inhibition stabilizes atherosclerotic plaques in hypercholesterolemic Apoe−/− mice. A, Representative images and quantification of macrophage tissue inhibitor of metalloproteinase (TIMP)-3 expression as assessed by immunofluorescence staining of brachiocephalic artery plaques from scrambled control and miR-181b inhibitor-treated Apoe−/− mice, n=6 to 8/group, *P<0.05, 2-tailed Student t test, scale bar represents 50 μm and is applicable to both panels. B, Representative images and quantification of proteolytic activity as assessed by in situ zymography of brachiocephalic plaques from scrambled control and miR-181b inhibitor-treated Apoe−/− mice, incubated with substrate alone or plus 10 nmol/L recombinant TIMP-3, #P<0.05 and represents significant difference from substrate alone; n=6 to 8 per group, **P<0.01 and denotes significant difference from scrambled control mice, ANOVA, scale bar represents 50 μm and is applicable to all panels. C, Representative images and quantification of (D) plaque cross-sectional area in elastin van Gieson (EVG)–stained sections, (E) ratio of total lesional vascular smooth muscle cells (VSMC) and macrophages (Mac) assessed by immunohistochemistry, (F) lesional collagen content assessed by picrosirius red staining, (G) lesional necrotic core area, (H) lesional proliferation percentage determined by immunohistochemistry for proliferating cell nuclear antigen (PCNA), (I) lesional apoptosis percentage determined by immunohistochemistry for cleaved caspase-3 (CC3), (J) the plaque vulnerability index (necrotic core area+macrophage content/VSMC+collagen content), (K) lesional elastin content assessed by EVG staining, in brachiocephalic plaques from scrambled control and miR-181b inhibitor-treated Apoe−/− mice, n=6 to 8/group, *P<0.05 and **P<0.01 compared with scrambled control mice, 2-tailed Student t test, scale bar in ii represents 100 μm and is applicable to panels i and ii, scale bar in iii represents 100 μm and is applicable to panels iii–viii, scale bar in ix represents 50 μm and is applicable to panels ix–xii. Arrows in panel’s ix–xii indicate positive cells. In all cases, data represent the mean±SEM.