
Figure 4.
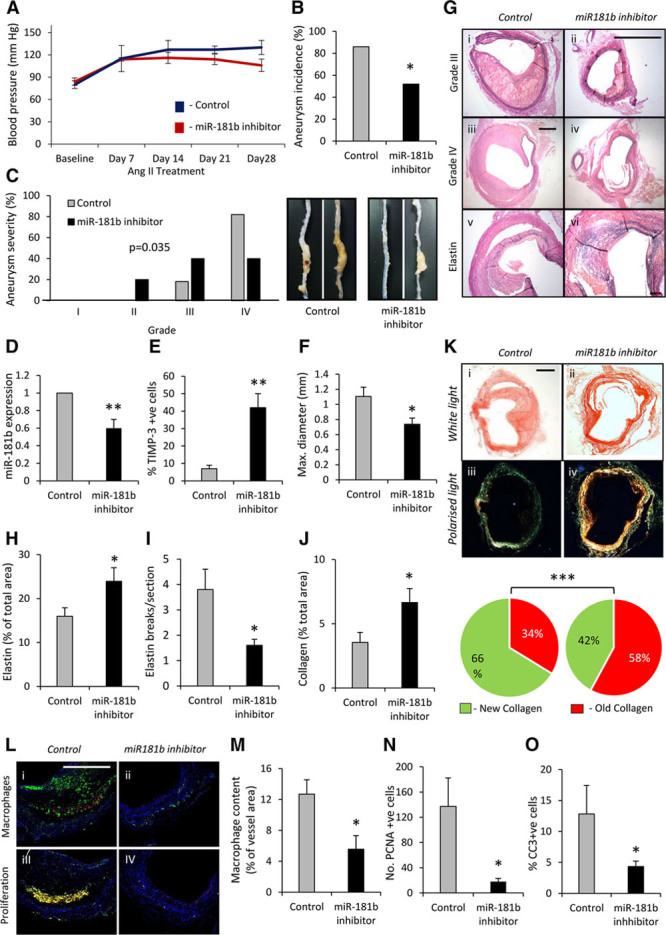
MicroRNA (miR) inhibition stabilizes abdominal aortic aneurysms (AAAs) in angiotensin II-infused Apoe−/− mice. A, miR-181b inhibition did not alter blood pressure levels. B, Quantification of aneurysm incidence and (C) severity (increasing severity from stage I to stage IV as described by Raffort et al12) in both groups of mice, using Fisher exact test and 2-tailed Student t test, respectively, n=6 to 8/group, *P<0.05. D, Quantification of miR-181b expression by quantitative polymerase chain reaction (Q-PCR) and (E) tissue inhibitor of metalloproteinase (TIMP)-3 protein expression by immunohistochemistry, n=6 to 8/group, **P<0.01 compared with scrambled control mice, 2-tailed Student t test. F, Maximal abdominal aortic diameter (mm) within the indicated groups, n=6 to 8/group, **P<0.05 compared with scrambled control mice, 2-tailed Student t test. G, Representative images of elastin van Gieson–stained histological cross-sections of AAAs from scrambled control and miR-181b inhibitor-treated Apoe−/− mice, demonstrating the differences in vessel diameter and elastin content (black), scale bar in ii represents 100 μm and is applicable to panels i, ii, and iv–x. Scale bar in iii represents 200 μm and is applicable to panels iii and iv. H, Quantification of elastin content and (I) elastin breaks in elastin van Gieson–stained AAAs, n=6 to 8/group, *P<0.05 compared with scrambled control mice, 2-tailed Student t test. J, Quantification of total collagen content in AAAs assessed by picrosirius red staining, n=6 to 8/group, *P<0.05 compared with scrambled control mice, 2-tailed Student t test. K, Representative picrosirius red staining viewed under white light and linearly polarized light to show fibrillar collagen in AAAs of scrambled control and miR-181b inhibitor-treated Apoe−/− mice (scale bar in i represents 200 μm and is applicable to all panels), and associated qualitative analysis of new (green) and old (red) fibrillar collagen fiber content, n=6 to 8/group, *P<0.001 compared with scrambled control mice, Fisher exact test. L, Representative images and quantification of (M) macrophage content (N) proliferation percentage determined by immunohistochemistry for proliferating cell nuclear antigen (PCNA), and (O) apoptosis percentage determined by immunohistochemistry for cleaved caspase-3 (CC3), in AAAs from scrambled control and miR-181b inhibitor-treated Apoe−/− mice, n=6 to 8/group, *P<0.05 compared with scrambled control mice, 2-tailed Student t test, scale bar in i represents 100 μm and is applicable to all panels. In all cases, data represent the mean±SEM.