
Figure 4.
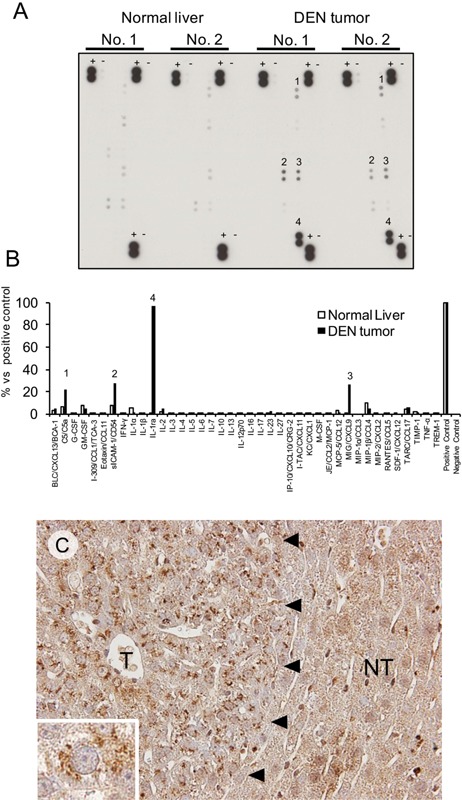
A: The cytokine/chemokine array analysis used a membrane to load the antibodies individually against 40 types of mouse cytokines/chemokines. Four factors (1: C5/C5a, 2: ICAM‐1, 3: CXCL9, 4: IL‐1ra) were increased in hepatic tumors compared with normal livers. +: positive control, −: negative control. B: Densitometric analysis of the above data. The data represent the average values for two normal livers and two DEN‐induced hepatic tumors. C: Immunohistochemical staining for C5/C5a in the focus (T) and in the surrounding non‐tumor hepatic tissue (NT) (left). Inset: high magnification of the focus cell.