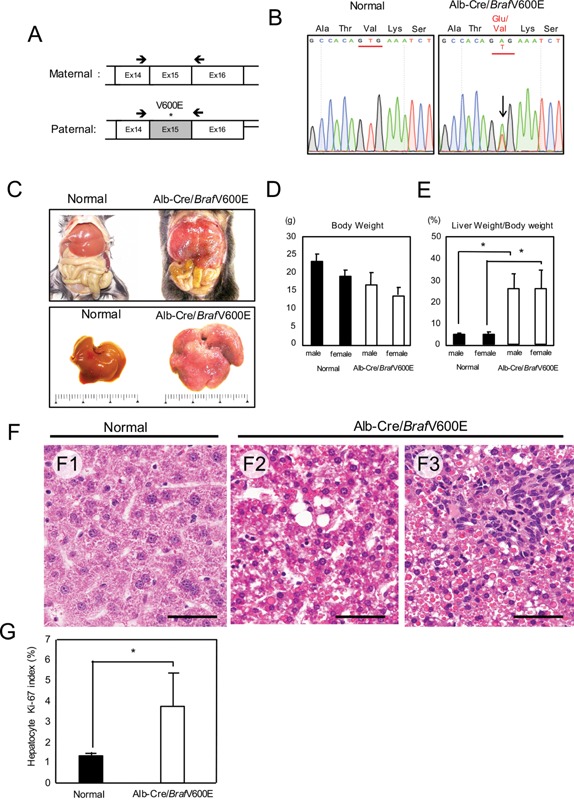
Figure 5.

Alb‐Cre/BrafV600E mice. A: RT‐PCR primers (arrows) targeting mutated human and normal mouse Braf exon 15. B: The mutated (A) and normal bases (T) in Alb‐Cre/BrafV600E mice (arrow in the right panel). C: Livers of normal and Alb‐Cre/BrafV600E mice (C). D: Body weight of normal (n: 10 males, 10 females) and Alb‐Cre/BrafV600E mice (n: 20 males, 20 females). E: Liver weight relative to body weight in normal (n: 10 males, 10 females) and Alb‐Cre/BrafV600E mice (n: 20 males, 20 females). *P < 0.01. F: Histology of the liver in normal (F1) and Alb‐Cre/BrafV600E mice at 8 wk (F2) and 12 wk after birth (F3). Scale bars: 50 μm. G: The Ki‐67 labeling index of hepatocytes in normal (n = 5) and Alb‐Cre/BrafV600E mice (n = 6). *P < 0.05.
