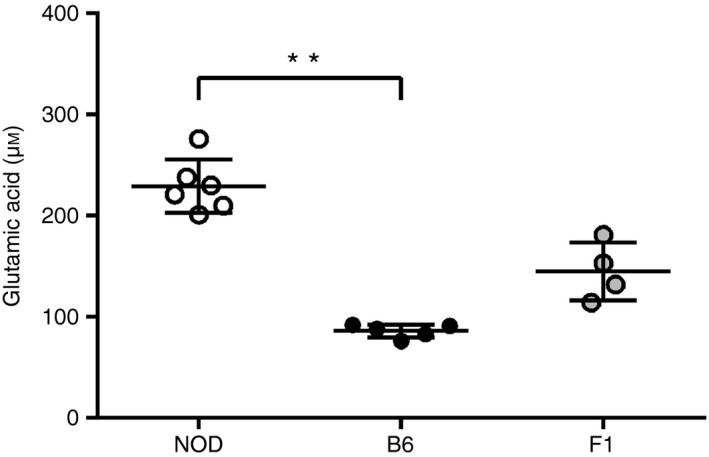
Figure 1.

Increased glutamic acid levels in non‐obese diabetic (NOD) mice. Sera from NOD (n = 6), C57BL/6 (B6) (n = 5) and (B6×NOD)F1 (n = 4) mice were analysed by LC‐MS. NOD mice displayed the highest concentration (229 μm), F1 an intermediate level (145 μm), and B6 the lowest (86 μm). Bars depict the mean ± SD for each strain. **P = 0.005
