
Figure 2.
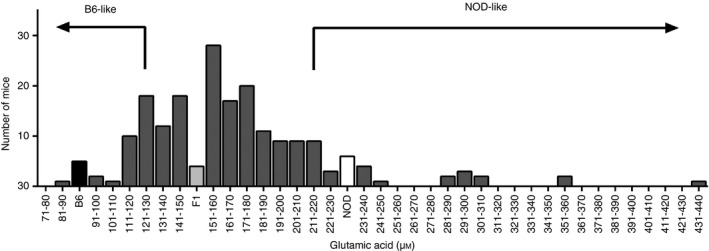
Phenotypic distribution of glutamic acid in a cohort of [C57BL/6 (B6) × non‐obese diabetic (NOD)]F2 mice. The glutamic acid level of the (B6×NOD)F2 mice (n = 182) was measured by LC‐MS. Based on parental strain glutamic acid levels, F2 mice were classified either as NOD‐like or B6‐like. These mice were used for mapping.