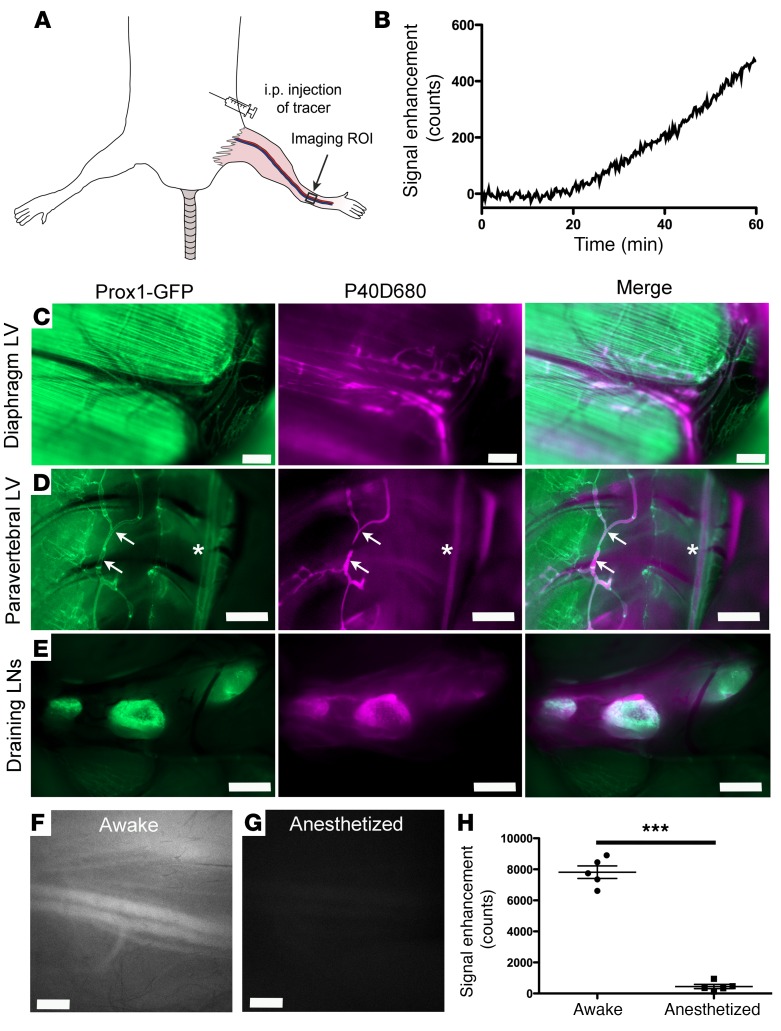
Figure 7. Lymphatic transport can be tracked from the peritoneal cavity.
(A) Nine-week-old albino female C57BL/6J mice were i.p. injected with 50 μl of 20 μM 40-kDa PEG–IRDye800 conjugate (P40D800) and dynamic imaging of the saphenous vein signal region of interest (ROI) was performed with the mouse in the supine position. (B) Plot showing saphenous vein signal enhancement during anesthetized conditions. Representative of n = 5 mice. (C–E) Images of peritoneal lymphatic outflow 30 minutes after injection of 50 μl of 10 μM 40-kDa PEG–IRDye680 conjugate (P40D680). Left images, Prox1-GFP; middle images, P40D680; right images, merge. Representative of n = 4 mice. (C) Presence of P40D680 in diaphragmatic lymphatic vessels (LVs). Prox1 is expressed also in diaphragmatic muscle. Scale bars: 500 μm. (D) P40D680 in paravertebral LVs (arrows) and thoracic duct (stars). Scale bars: 1 mm. (E) P40D680 in tracheobronchal (right lymph node [LN]) and 2 mediastinal LNs. Scale bars: 1 mm. (F) Representative saphenous vein image at t = 60 minutes after i.p. injection, during which mice were awake and moving normally. (G) Representative saphenous vein image at t = 60 minutes after i.p. injection with mouse under anesthesia. Scale bars: 500 μm. (H) Quantification of the fluorescent signal enhancement at t = 60 minutes comparing mice that were awake with those that were under anesthesia. n = 5 each condition. ***P < 0.001 (2-tailed Student’s t test). Data are the mean ± SD.

