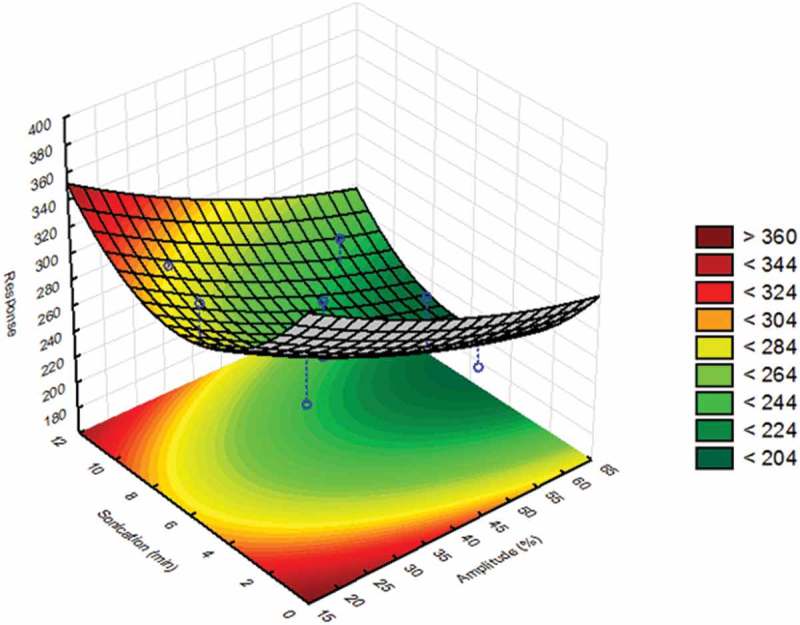
Figure 2.

Statistical evaluation of the sample preparation by focused ultrasound: response surface and contour plot of JRCNM0-1004a (TiO2) in which particle size (nm) measured at 65 min is plotted against the amplitude/power (19–61%) of the ultrasound system and the sonication time (1.5–11.5 min).
