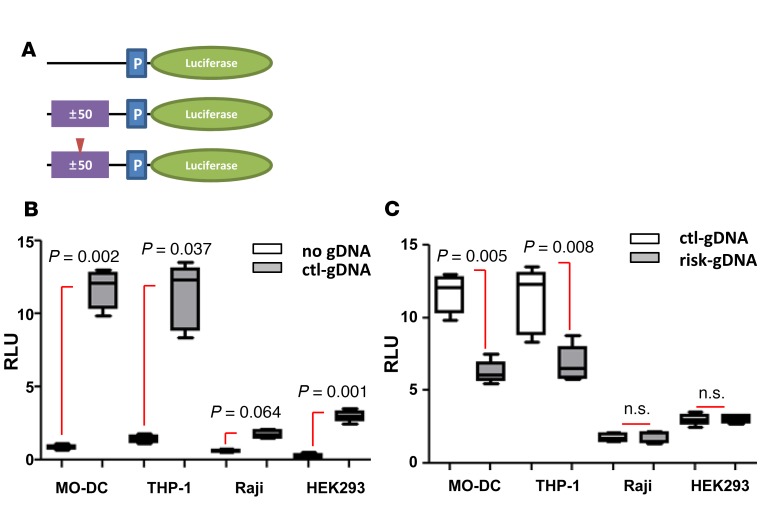
Figure 4. Gene regulatory function of SNP-containing genomic DNA.
(A) Diagram of reporter constructs containing genomic DNA (gDNA) (purple box). 100 bpgDNA (± 50 bp from SNP) from nonrisk allele (middle) or from risk allele (bottom; red arrowhead indicates risk allele) was inserted upstream of promoter region (P, blue box). (B and C) Each cell type was transfected with plasmid as indicated. Tk-Renilla with CMV promoter plasmid was cotransfected as a control. Cells were harvested 6 hours (MO-DC, THP-1, and Raji) or 48 hours (HEK293) after transfection, and luciferase level was measured. In the box-and-whisker plot, horizontal bars indicate the medians, boxes indicate 25th to 75th percentiles, and whiskers indicate 10th and 90th percentiles (n = 5). The nonparametric, Mann-Whitney test was used for statistics.

