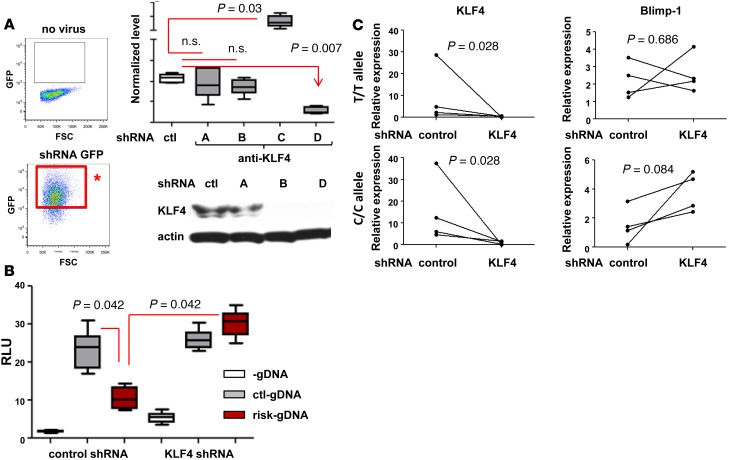
Figure 5. Knockdown of KLF4 abolished the regulatory effect by risk allele.
(A) KLF4 knockdown by shRNA. Four different KLF4-targeting shRNA constructs (A, B, C, and C) and scrambled control shRNA lentivirus were infected into THP-1 cells. Four days after two rounds of infection, shRNA-positive cells were purified based on GFP expression (red box with asterisk). Cells with each construct were harvested, and mRNA and protein levels were measured by qPCR and Western blotting, respectively. Whisker plot represents the mean to max (n = 3). The Western blot image is representative of 3 experiments. (B) Promoter assay was performed in KLF4dl THP-1 cells. Each plasmid was transfected into either control shRNA or KLF4 shRNA (KLF4dl) as shown in figure, and luciferase activity was measured. In the box-and-whisker plot, horizontal bars indicate the medians, boxes indicate 25th to 75th percentiles, and whiskers indicate 10th and 90th percentiles (n = 3). (C) MO-DCs from control or risk allele carriers were infected with control shRNA or KLF4 shRNA lentivirus at day 5 and day 7 during differentiation. Four days after the second infection (day 9), GFP-positive MO-DCs were sorted and the level of KLF4 and BLIMP1 was measured by qPCR. Each dot represents an individual sample (n = 4). The nonparametric, Mann-Whitney test was used for statistics.

