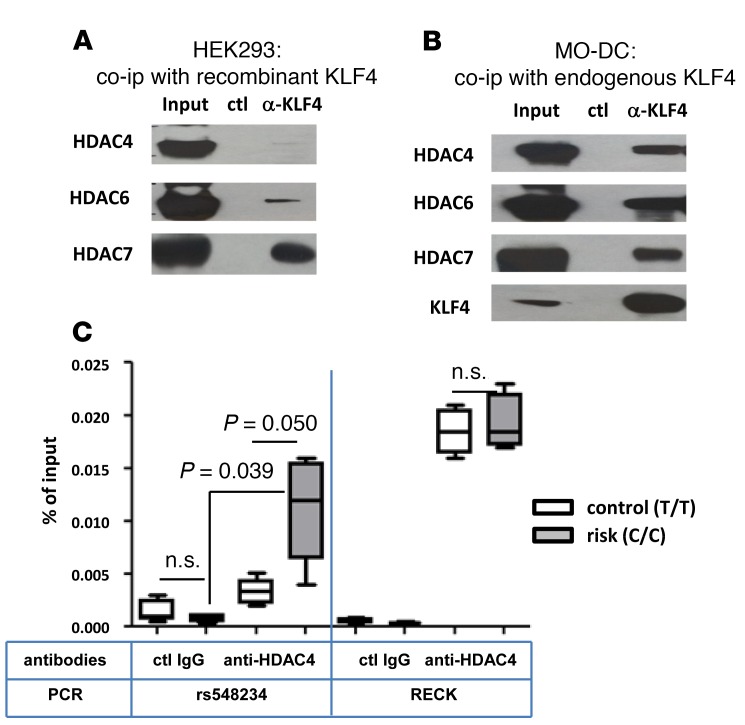
Figure 6. Direct interaction between KLF4 and HDACs and recruitment of HDAC4 to rs548234 risk allele.
Coimmunoprecipitation was performed with HEK293 cells (A) or MO-DCs (B) after KLF4 plasmid transfection. In both experiments, anti-KLF4 Ab or control Ab was incubated with total cell lysate overnight. Ab-protein complex was eluted, and Ab-bound proteins were separated by 4%–12% Bis-Tris protein gel. Untreated total input was loaded as a positive control. To detect HDACs, anti-HDAC antibodies were used. A representative image is shown from 3 independent experiments. (C) Recruitment of HDAC4 to the SNP region was measured by ChIP assay. Anti-HDAC4 Ab or control IgG was incubated with chromatin prepared from MO-DCs with the nonrisk control (T/T, white) or the risk (C/C, black) allele. Binding of HDAC4 to the SNP region was assessed by qPCR using SNP region-specific primers, and the percentage of input gDNA was calculated. Quantitation of the RECK promoter region was used as a positive control. In the box-and-whisker plot, horizontal bars indicate the medians, boxes indicate 25th to 75th percentiles, and whiskers indicate 10th and 90th percentiles (n = 4). The nonparametric, Mann-Whitney test was used for statistics.

