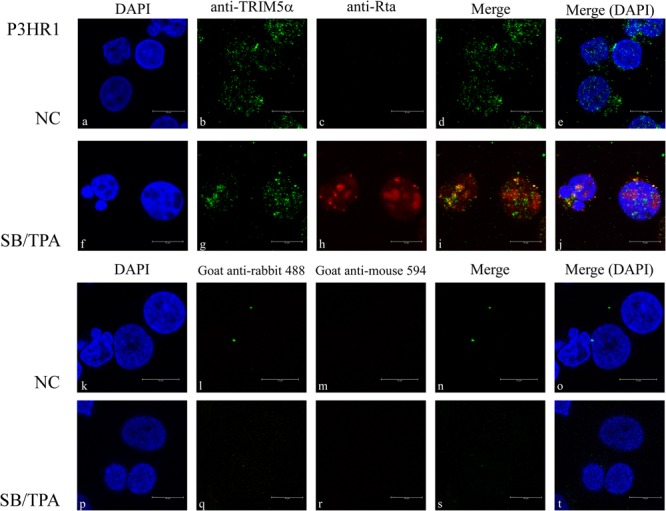
FIGURE 3.

Subcellular localization of Rta and TRIM5α. P3HR1 cells were treated with sodium butyrate and TPA (SB/TPA) or DMSO (NC) for 24 h. Cells were incubated with monoclonal anti-Rta antibody (c,h) and polyclonal anti-TRIM5α antibody (b,g). Cells were also stained with secondary antibodies (k–t) as a control. Nuclei were visualized by DAPI staining (a,f). Cells were observed under a confocal laser-scanning microscope, and (d,e,i,j,n,o,s,t) are merged images. Scale bar indicates 10 μm.
