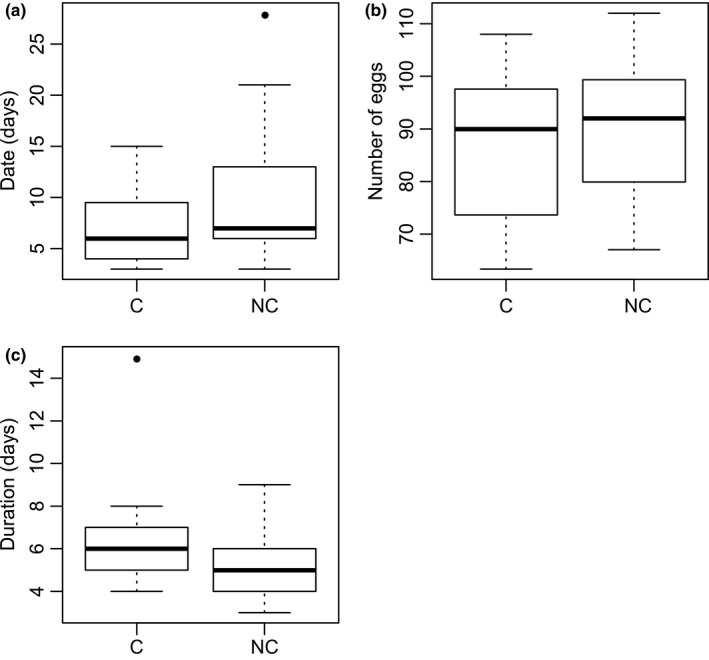
Figure 1.

Distribution of the different characteristics of the fecundity peak. (a) Date of fecundity peak (in number of days since the beginning of experiment). (b) The number of eggs at the fecundity peak (in number of eggs). (c) Duration of the fecundity peak (in number of days, see main text for a detailed explanation of this calculation). Only the date of fecundity peak is significantly different between cancerous (c) and noncancerous (NC) individuals (p‐value = .025)
