Figure 2.

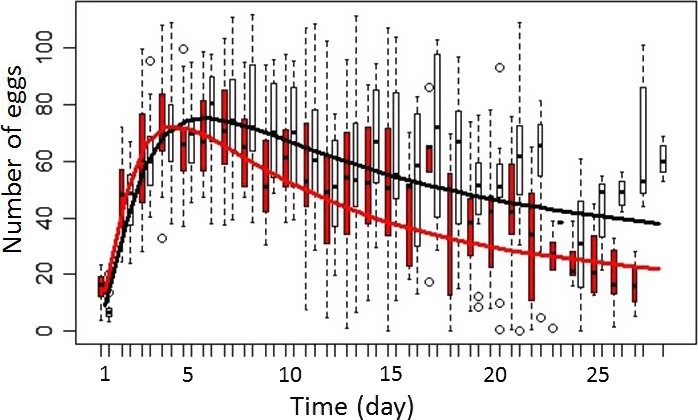
Difference in number of egg laid by cancerous females (in red) and noncancerous ones (in black) as a function of time. The fitted lines are the result of the function: log(Age)*CancerousStatus+log(Age)2

Difference in number of egg laid by cancerous females (in red) and noncancerous ones (in black) as a function of time. The fitted lines are the result of the function: log(Age)*CancerousStatus+log(Age)2