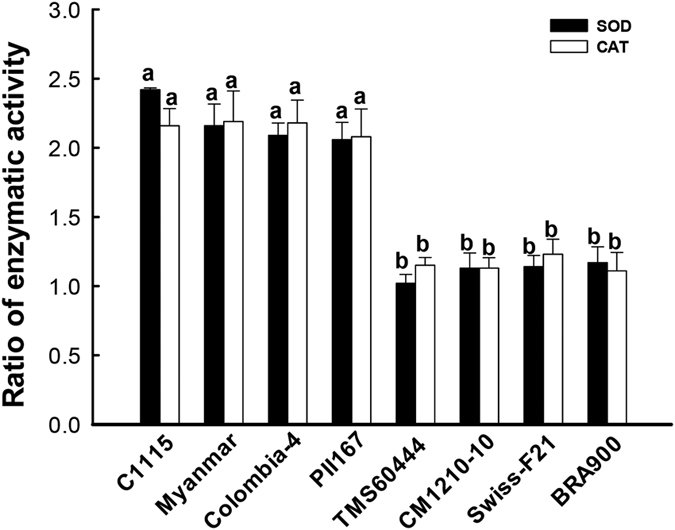
Figure 2. Changes in SOD and CAT activities in different cassava cultivars damaged by T. cinnabarinus.

The changes in SOD or CAT activities were presented as the ratio of the activities in 8 d–damaged leaf and the same leaf before being damaged by T. cinnabarinus. Different letters above the standard error bars indicate significant differences in the activities of SOD or CAT in different cassava cultivars, which were based on the one-way ANOVA followed by Tukey’s HSD multiple comparison test (P < 0.05).
