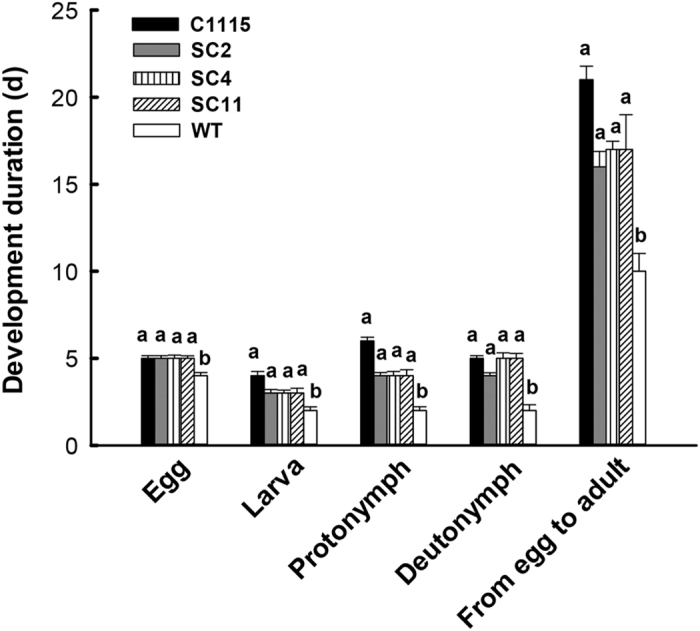
Figure 6. Duration of development period in T. cinnabarinus feeding on different cassava plants.

Different letters above the standard error bars indicate significant differences among each life stage based on the one-way ANOVA followed by Tukey’s HSD multiple comparison test (P < 0.05).
