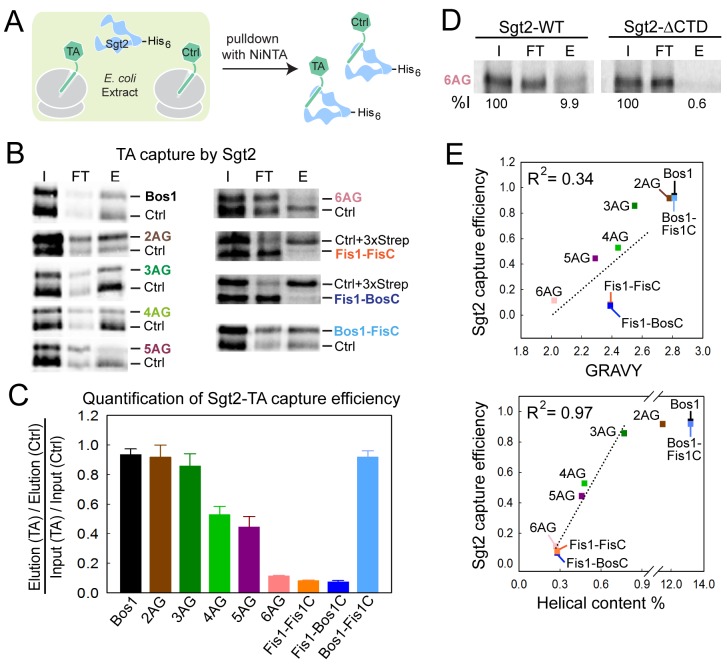
Figure 4. Sgt2 discriminates TAs based on features in the TMD.
(A) Schematic of the assay to measure and compare the efficiency of TA capture by Sgt2. All TAs were translated, captured, and purified in parallel with an internal control, Bos1 (Ctrl + 3xStrep) or Bos1 lacking the N-terminal 3xStrep tag (Ctrl). (B) Representative autoradiograms of 35S-methionine labeled TA substrates during affinity purification of His6-Sgt2•TA complexes. I, FT, and E denote input, flowthrough, and elution, respectively. (C) Quantification of the experiments in (B) and their repetitions. All values for the TA of interest were normalized against Ctrl or Ctrl + 3xStrep. Normalized TA capture efficiencies were reported as mean ± S.E.M, with n = 3–7. (D) Representative autoradiogram of 35S-methionine labeled 6AG during capture and purification by wildtype His6-Sgt2 (left panel) or mutant His6-Sgt2△CTD lacking the TA binding domain (right panel). Quantifications of substrate recovery in the elutions were indicated below the gels. (E) Correlation of the relative Sgt2 capture efficiencies of TA variants with the GRAVY scores (top panel) and helical content (bottom panel) of their TMDs. Substrates included in the correlation analyses are 3AG–6AG, Fis1-FisC and Fis1-BosC. The high capture efficiencies of Bos1, Bos1-FisC and 2AG (>90%) render them outside the dynamic range of this assay and were therefore not included in the correlation analysis. GRAVY scores and % helical content were from Figure 1C.

