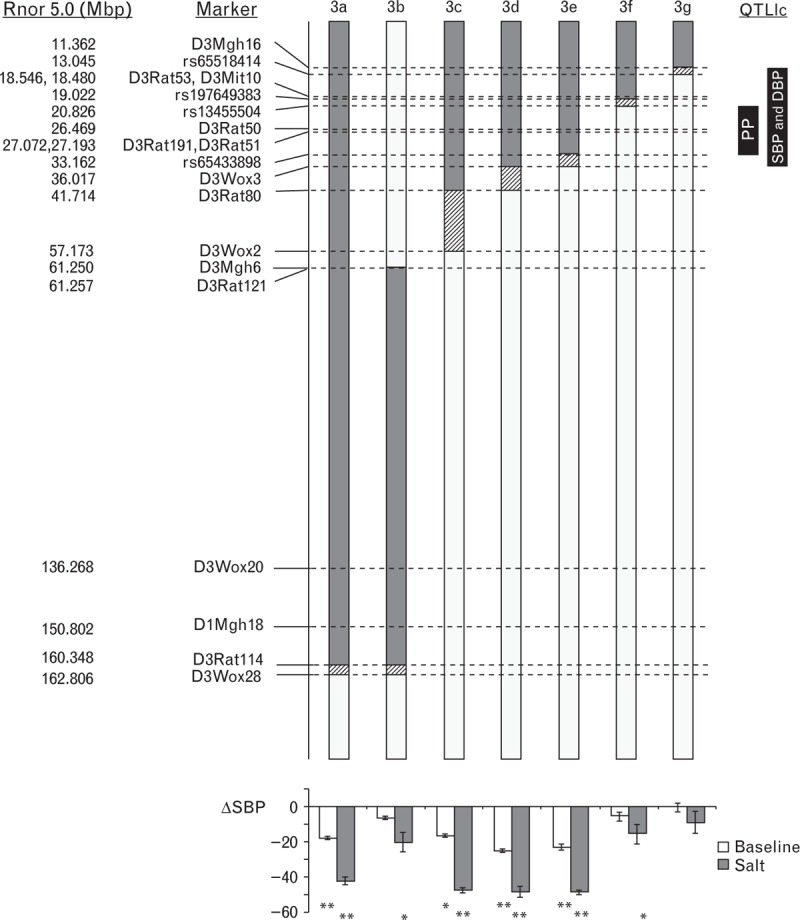
FIGURE 1.

Congenic interval mapping based on physical locations of polymorphic microsatellite markers and SNPs in a panel of congenic sub-strains. Grey and white bars indicate regions of WKY and SHRSP homozygosity, respectively, whereas hatched bars indicate areas containing a recombination. The location of previously identified systolic blood pressure (SBP), diastolic blood pressure (DBP) and pulse pressure (PP) loci [18] is indicated to the right of the figure. Mean change in baseline and salt-loaded SBP in comparison to the SHRSP parental strain is illustrated below each of the respective congenic sub-strains. ∗P < 0.05, ∗∗P < 0.001 versus SHRSP for baseline and salt challenge, respectively. SHRSP, stroke-prone spontaneously hypertensive; WKY, Wistar–Kyoto.
