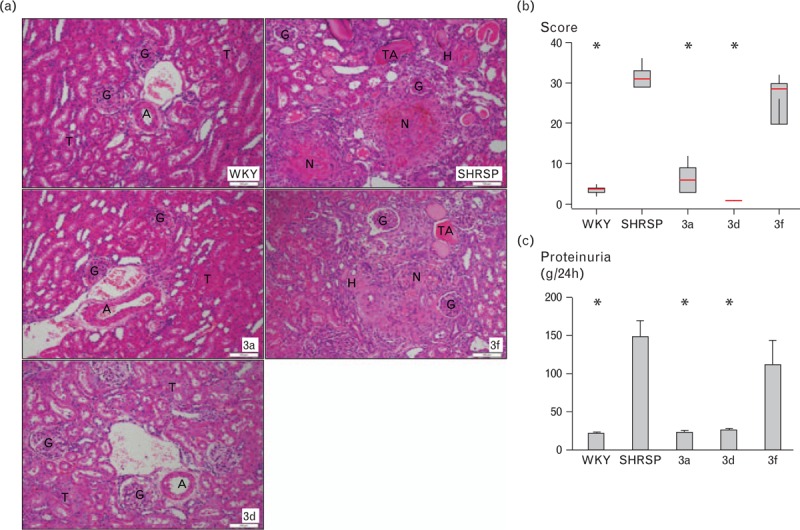
FIGURE 4.

Renal phenotypes. (a) Representative histology images of H&E-stained kidneys of WKY, SP.WKYGla3a and SP.WKYGla3d rats, where the renal parenchyma shows normal arteries (A), glomeruli (G) and tubules (T). In contrast, the representative images of the typical areas of the kidneys of SHRSP and SP.WKYGla3f rats display major vascular changes demonstrating necrosis of the wall (N) with haemorrhage into the surrounding tissue, arterioles with severe hyalinosis (H) and areas of tubular atrophy (TA). Glomeruli (G) show ischaemic changes, but no specific lesions. Magnification = 100×; Scale bar = 100 μm. (b) Renal histopathology scores (n = 7–11/group) and (c) proteinuria (n = 6–11/group). ∗P < 0.001 versus SHRSP. H&E, haematoxylin and eosin; SHRSP, stroke-prone spontaneously hypertensive; WKY, Wistar–Kyoto.
