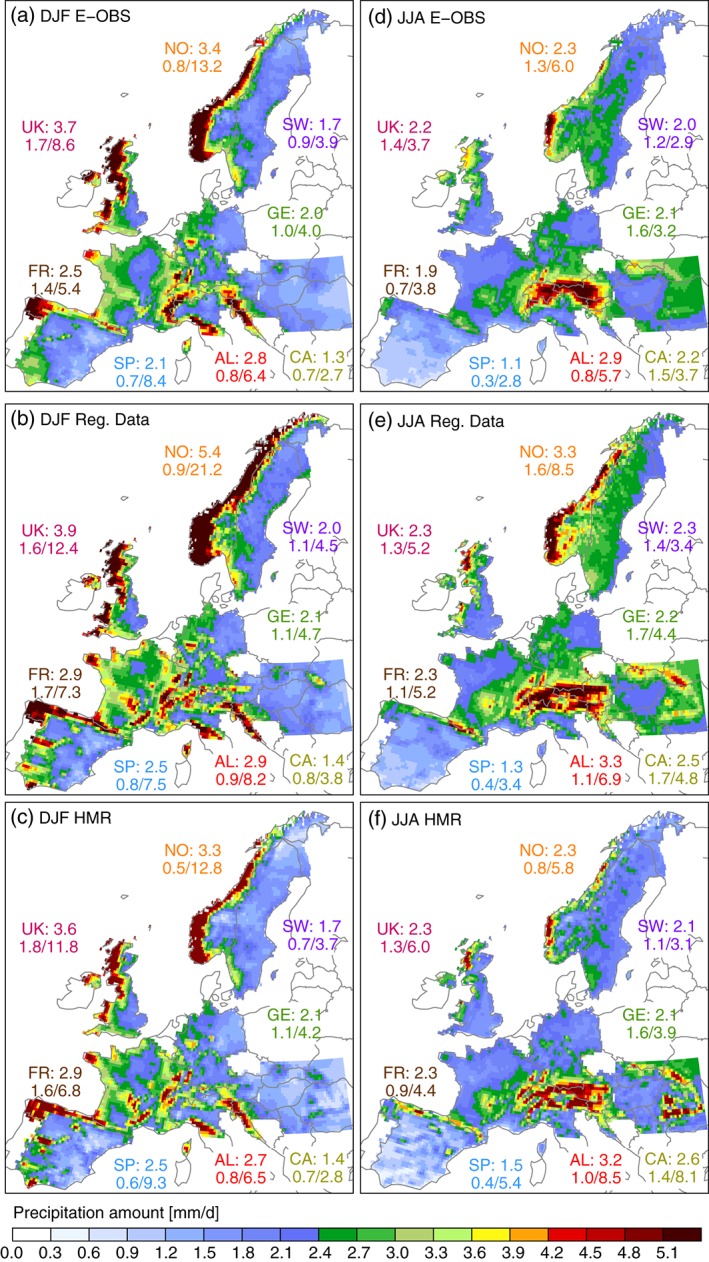
Figure 2.

Seasonal average precipitation in DJF (left) and JJA (right) for E‐OBS (first row), the RDs (second row), and the HMR (third row). Shown beside the regions is the mean, minimum, and maximum seasonal average precipitation of the grid cell values in the region. The Alpine data set applies to the red hatched areas in Figure 1(b)) while in Norway results from the Norwegian data set are shown.
