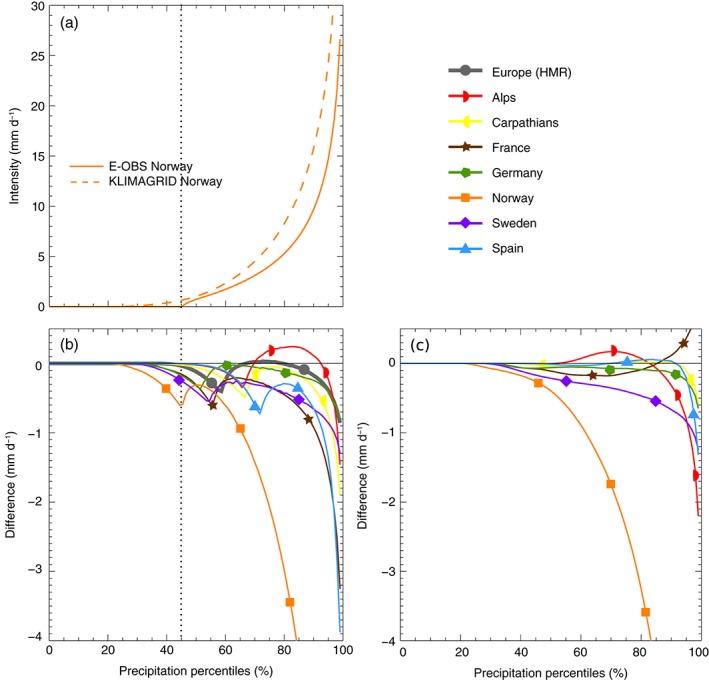
Figure 6.

Empirical quantile functions of daily precipitation from E‐OBS and the KLIMAGRID data set in Norway during DJF (panel a). Differences between the quantile functions (E‐OBS minus RDs) in all regions during DJF are shown in panel b. The grey dotted line depicts the percentile below which E‐OBS has zero precipitation in Norway. Differences between the quantile functions of the HMR and the RDs are shown in panel c.
