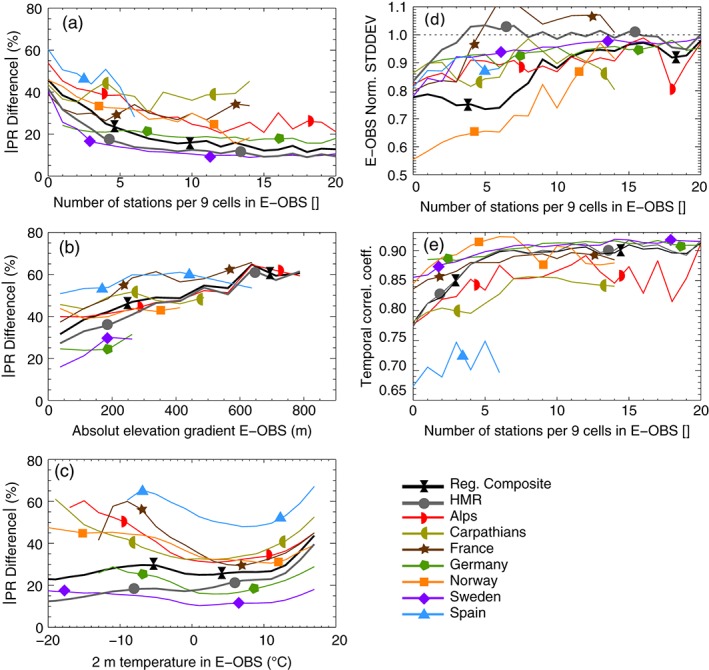
Figure 7.

Median absolute differences in daily precipitation are shown dependent on the E‐OBS station density in the eight adjacent grid cells around a cell (panel a), the mean absolute elevation gradient to the adjacent grid cells (panel b), and the 2 m temperature in E‐OBS (panel c). Panel d shows the median (over grid cells) temporal standard deviation of daily precipitation from the data sets divided by the standard deviation of E‐OBS as a function of E‐OBS station density. Panel e shows the same for the Spearman rank correlation coefficients.
