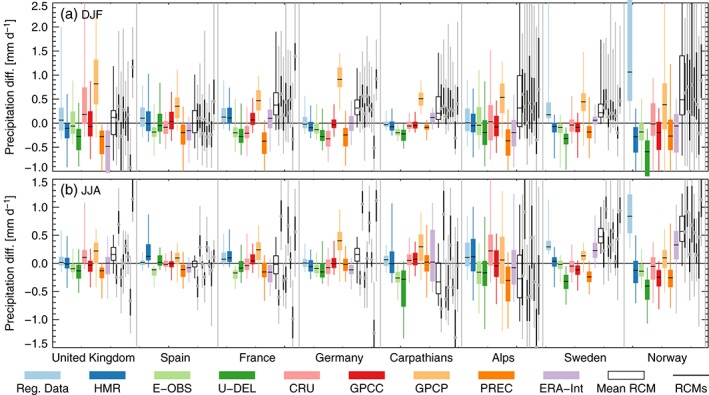
Figure 11.

Box‐Whisker statistics showing the spatial spread for seasonal mean precipitation biases between the precipitation in the mean observational data set and the precipitation in the individual observations (colored boxes), the mean model (empty box), and the individual models (thin black boxes with circles showing the median). The boxes show the 25–75 quantile distance while the whiskers show the 5–95 quantile range. Results for DJF/JJA are shown in panel a/b.
