Figure 12.

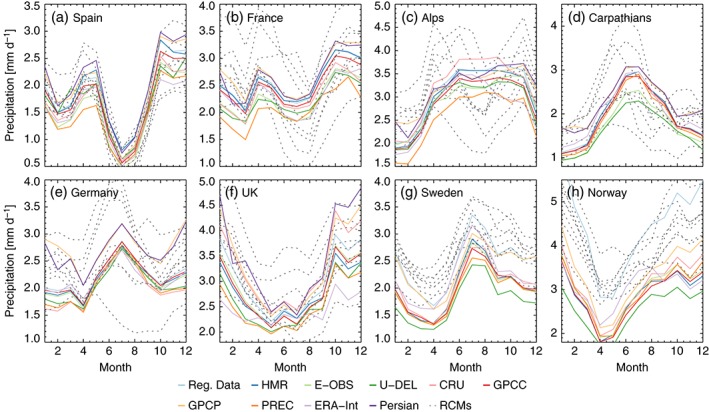
Annual cycle of monthly mean precipitation in different sub‐regions (panels). Results from the observational data sets are shown as coloured lines while precipitation from climate models is shown as grey‐dotted lines.

Annual cycle of monthly mean precipitation in different sub‐regions (panels). Results from the observational data sets are shown as coloured lines while precipitation from climate models is shown as grey‐dotted lines.