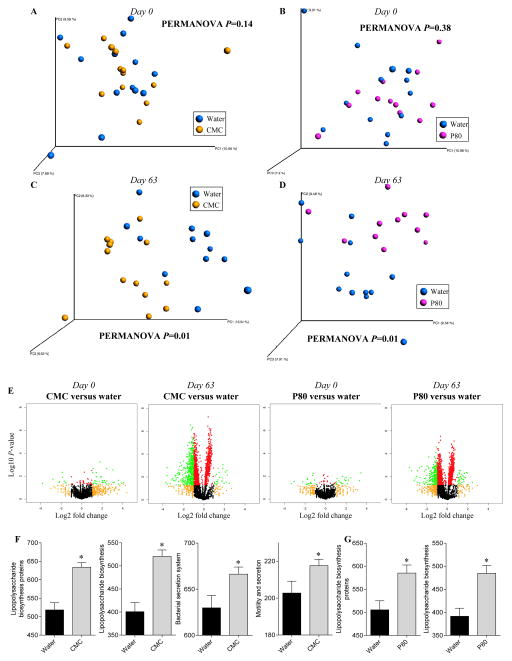
Figure 4. Profound metagenome alteration following CMC and P80 consumption.
WT mice were exposed to drinking water containing CMC or P80 (1.0%) for 13 weeks. PICRUSt (Phylogenetic Investigation of Communities by Reconstruction of Unobserved States) was used to predict the metagenomes, subsequently analyzed by principal coordinates analysis of the beta diversity using binary jaccard method at day 0 (A–B) and day 63 (C–D). (E) Kyoto Encyclopedia of genes and genomes (KEGG) pathways were visualized on a volcano plot. From left to right: water-treated versus CMC-treated at day0; water-treated versus CMC-treated at day63; water-treated versus P80-treated at day0; water-treated versus P80-treated at day63. For each KEGG identifier, the difference in abundance between the two groups is indicated in log2 fold change on x-axis (with positive values corresponding to an increase in emulsifier-treated group compare to water-treated group, and negative values corresponding to a decrease in emulsifier-treated group compare to water-treated group), and significance between the two groups is indicated by log10 p-value on the y-axis. Red dots correspond to KEGG identifiers with a p-value <0.05 between emulsifier-treated and water-treated groups. Orange dots correspond to KEGG identifiers with at least a 2-fold decreased or increased abundance in emulsifier-treated group compare to water-treated group. Green dots correspond to KEGG identifiers with at least a 2-fold decreased or increased abundance in emulsifier-treated group compare to water-treated group and with a p-value <0.05. (F–G) Predicted metagenomes were categorized at level 3 of the KEGG pathways, and pathways involved in lipopolysaccharide biosynthesis, secretion system synthesis and motility were graphed. Data are the means +/− S.E.M. (n=5–8). Significance was determined using t-test (* indicates p<0.05).

