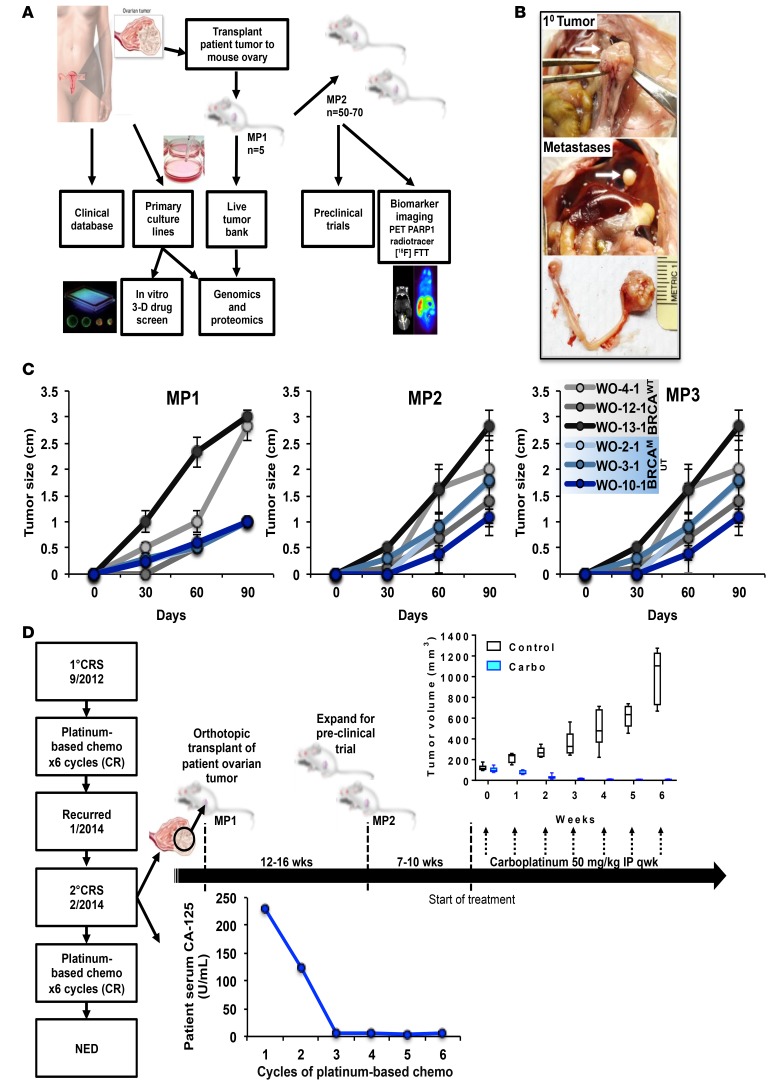
Figure 1. A potentially novel BRCAMUT ovarian patient-derived-xenograft (PDX) platform.
(A) Patient tumors removed during surgery are transplanted onto the fallopian tube fimbria/ovaries of NSG mice for PDX development and grown in tissue culture. Mouse tumors are then used to establish a live tumor bank or expanded for preclinical trials. Models can also be used for functional biomarker studies. Targeted genomic sequencing and reverse phase protein array (RPPA) analysis is performed on all patient and PDX samples. Primary tumor cultures may be used for in vitro 2D and 3D drug screening. (B) Representative BRCAMUT PDX (c.8945delAA; WO-2-1) 10 weeks after transplantation showing primary tumor replacing host ovary (upper panel), diaphragmatic metastasis (middle panel), and primary ovarian tumor and normal mouse ovary (lower panel). (C) PDX tumor size by palpation over time for select PDX models comparing BRCAMUT (WO-2-1, WO-3-1, WO-10-1) with BRCAWT (WO-4-1, WO-12-1, WO-13-1) HGSOC over 3 mouse passages (MPs). BRCAMUT PDXs demonstrated slower growth rates compared with BRCAWT at MP1 (0.11 mm/day vs. 0.29 mm/day; P < 0.001). However, in subsequent passages MP2 and MP3, growth rates were similar (0.19 mm/day for BRCAMUT vs. 0.25 mm/day for BRCAWT; P = 0.08 for MP2, 0.177 mm/day for BRCAMUT vs. 0.18 mm/day for BRCAWT; P = 0.9 for MP3). Dots represent mean of determinations with SEM. A linear mixed-effects model was used to compare growth rates/day between groups. Individual mouse data shown in dot plots in Supplemental Figure 4. (D) Example of preclinical platform using a BRCA2MUT (c.8945delAA) PDX model (WO-2). The patient was diagnosed with ovarian cancer in 2012 and had primary cytoreductive surgery (1° CRS) followed by standard chemotherapy (carboplatin and paclitaxel) and had a complete remission (CR). Tumor obtained at secondary CRS for recurrent disease in January 2014 was used for PDX generation. PDX tumors grew in 12 to 16 weeks to approximately 1,000 mm3. Tumors were harvested and expanded for a preclinical trial. Mice were randomized to control or carboplatin 50 mg/kg weekly and tumor growth as measured by weekly ultrasound. All mice showed CR. Similarly, the patient’s tumor also responded to a platinum-based chemotherapy regimen as illustrated in the graph of her serum CA-125. The box-and-whisker plots show the median, with boxes extending from the 25th to 75th percentile and the whiskers extending from minimum to maximum values of the dataset. Control, n = 9 mice; carboplatin, n = 6 mice.

