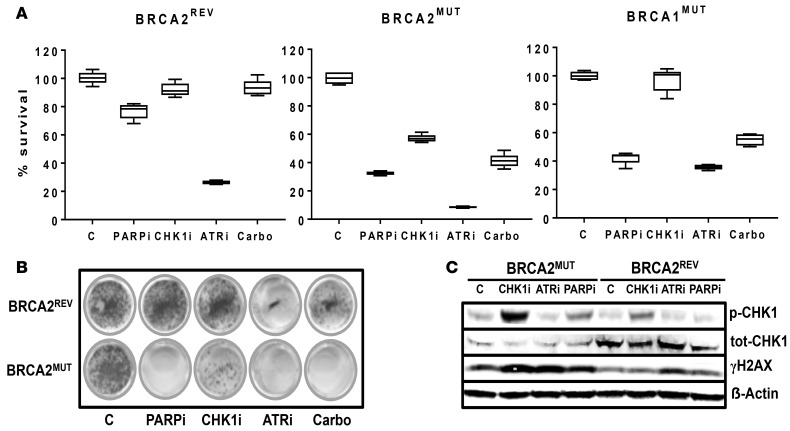
Figure 5. Targeting the ATR-CHK1 axis in BRCA1/2MUT cell models.
(A) Viability of established ovarian cancer cells after treatment with 1 μM PARPi (AZD2281), 1 μM CHK1i (MK8776), 1 μM ATRi (AZD6738), and 30 μM carboplatin was assessed with an MTT assay. Cell models included PEO1 (BRCA2MUT), JHOS4 (BRCA1MUT), and the homologous recombination–proficient cells, PEO4 (BRCA2REV). Cells were incubated in their respective drug concentrations for 5 days. PARPi was significantly more cytotoxic in BRCAMUT relative to BRCA2REV cells (32.9% ± 0.7% cell viability for BRCA2MUT cells and 42.3% ± 2.0% for BRCA1MUT cells vs. 76.7% ± 2.0% for BRCA2REV cells; P < 0.00001 and P = 0.0002 for BRCA2 vs. BRCAREV and BRCA1 vs. BRCAREV, respectively). Carboplatin treatment appeared to have a similar effect to that of PARPi in all lines: BRCA2MUT (41.2% ± 3.9% cell viability; P = 0.07 carboplatin compared with PARPi); BRCA1MUT (55.0% ± 5.2% viability; P = 0.0003 carboplatin vs. PARPi); and BRCA2REV (96.3% ± 4.6% viability; P = 0.01 carboplatin vs. PARPi). Only the BRCA2MUT cell model was sensitive to 1 μM CHK1i (56.6% ± 1.1% cell viability). Both BRCAMUT and BRCA2REV cells were sensitive to ATRi monotherapy (8.6% ± 0.2%, 38.9% ± 1.4%, and 26.3% ± 0.5% cell viability for BRCA2MUT, BRCA1MUT, and BRCA2REV cells, respectively; P < 0.001 for all lines ATRi vs. carboplatin treatment). The box-and-whisker plots show the median, with boxes extending from the 25th to 75th percentile and the whiskers extending from minimum and maximum values of the dataset (n = 5 per group). Two-way ANOVA was performed before the Tukey’s honestly significant difference test to determine whether there was an overall difference between the groups. The data shown are a single representative experiment with 5 determinations. Three independent experiments were performed. (B) Colony forming assay was performed with 1 μM PARPi, 1 μM CHK1i, 1 μM ATRi, and 30 μM carboplatin treatment in BRCA2MUT (PEO1) and BRCA2REV (PEO4) cell models. Cells were incubated in their respective drug concentrations for 13 days. Colony formation was decreased in BRCA2MUT compared with BRCA2REV cells with PARPi (3.3% ± 1.3% vs. 116.8% ± 5.2%; P < 0.00001), CHK1i (28.6% ± 3.1% vs. 94.1% ± 6.0%; P = 0.0001), and carboplatin (3.9% ± 1.2% vs. 43.3% ± 2.8%; P < 0.00001). All values are percentage colony formation relative to control. Both cell models showed decreased colony formation with ATRi (6.4% ± 1.6% for BRCA2MUT vs. 10.9% ± 1.4% for BRCA2REV; P = 0.08). (C) BRCA2MUT (PEO1) and BRCA2REV (PEO4) cells were treated with 1 μM PARPi, 1 μM CHK1i, and 1 μM ATRi and lysates were collected after 24 hours of treatment. Western blot for the indicated total and phosphoproteins is shown.

