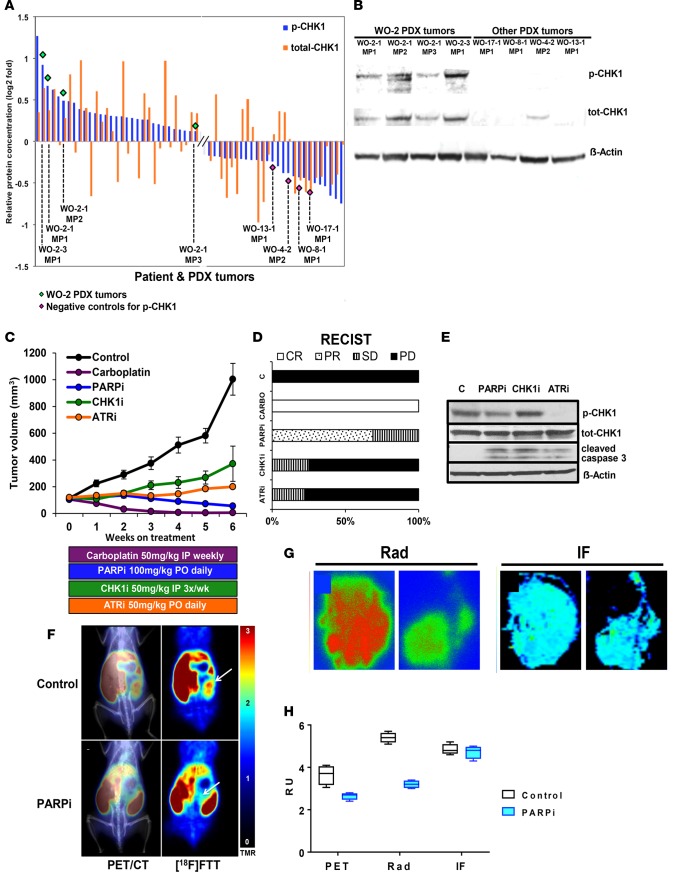
Figure 6. Targeting the ATR-CHK1 axis in a BRCA2MUT PDX model.
(A) Reverse phase protein array (RPPA) analysis for 308 total and phosphoproteins in patient tumors and their corresponding PDXs were analyzed. Two proteins (p-CHK1 on Ser345 and total CHK1) were selected and plotted on a log2-fold scale. WO-2-1 (BRCA2MUT c.8945delAA) demonstrated elevated p-CHK1 relative to other tumors. (B) PDX tumors with high and low p-CHK1 by RPPA were compared by Western blot for p-CHK1 and total CHK1. (C and D) WO-2-1 PDXs were randomized into the following groups: vehicle control; PARPi (AZD2281) 100 mg/kg by oral gavage daily; CHK1i (MK8776) 50 mg/kg i.p. every 3 days; ATRi (AZD6738) 50 mg/kg daily; and carboplatin 50 mg/kg weekly. Tumor volume was measured by weekly ultrasound. There was a significant decrease in all treatment groups relative to control (P < 0.0001) and a significant difference relative to carboplatin treatment (P = 0.0001 for PARPi, P = 0.0072 for CHK1i, and P < 0.00001 for ATRi). ANOVA analysis was conducted to evaluate differences among means. Tukey’s honestly significant difference (HSD) test was used for all pairwise mean comparisons. PARPi treatment decreased average tumor volume by 35% over treatment duration with 68.8% (n = 11 of 16) and 31.2% (n = 5 of 16) showing partial remission (PR) and stable disease (SD), respectively, by RECIST 1.1 (37). CHK1i treatment resulted in a 25% (n = 2 of 8) SD rate and 75% (n = 6 of 8) with PD (progression of disease). ATRi treatment resulted in a 22.2% (n = 2 of 9) SD rate, and 77.8% (n = 7 of 9) with PD in average tumor volume, respectively. Carboplatin treatment resulted in 100% CR. Each symbol represents mean of determinations with SEM. Control, n = 7; PARPi n = 16; carboplatin, n = 5; ATRi, n = 9; CHK1i, n = 6 (see Supplemental Figure 9 for individual mouse response). (E) Lysates from PDX tumors after 2 weeks of treatment were immunoblotted for the indicated proteins. (F) PET imaging of PARP-1 with [18F]FTT and PET/CT fused images are shown in untreated and PARPi-treated mouse. WO-2-1 (BRCA2MUT c.8945delAA) PDX received oral doses of PARPi (AZD2281) 50 mg/kg every day for 1 month and on the day of PET imaging prior to the imaging study. White arrows point to tumors. (G) Digital autoradiography (left panel) of tumor sections and PARP-1 immunofluorescence (IF; right panel) of adjacent tumor sections comparing control with PARPi-treated tumor sections (n = 2) is shown. Representation of 1 of 2 independent experiments is shown. (H) Correlative data shown for PET, autoradiography (Rad), and IF modalities for determining PARP-1 expression. Graphical representation of 3 independent experiments and associated results are shown. Four regions of interest were drawn in each dataset. The box-and-whisker plot shows the median, with boxes extending from the 25th to 75th percentile and the whiskers extending from minimum to maximum values of the dataset (n = 4).

