
Figure 2.
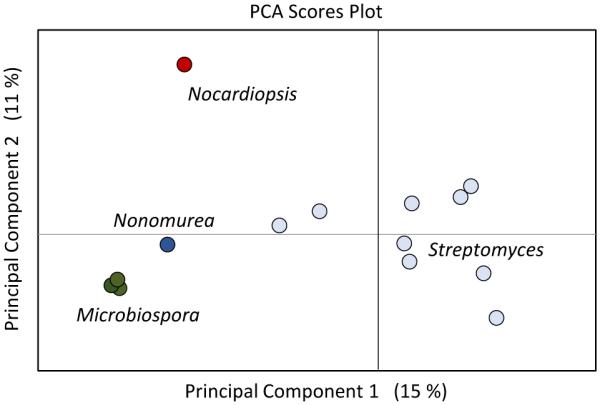
Using a pca scores plot to prioritize microbial producers. a panel of actinomycetes including microbiospora, streptomyces, and nonomurea genera. in this analysis, 14 strains grown under identical conditions were compared and principal component analysis was used to display metabolomic feature variance between the strains. principal component 1 primarily groups streptomyces from other strains, and component 2 further distinguishes nocardiopsis sp. fu40 as metabolomically unique compared to other tested strains. percentages shown in parentheses correspond to the variance between the samples contained within the specific component.