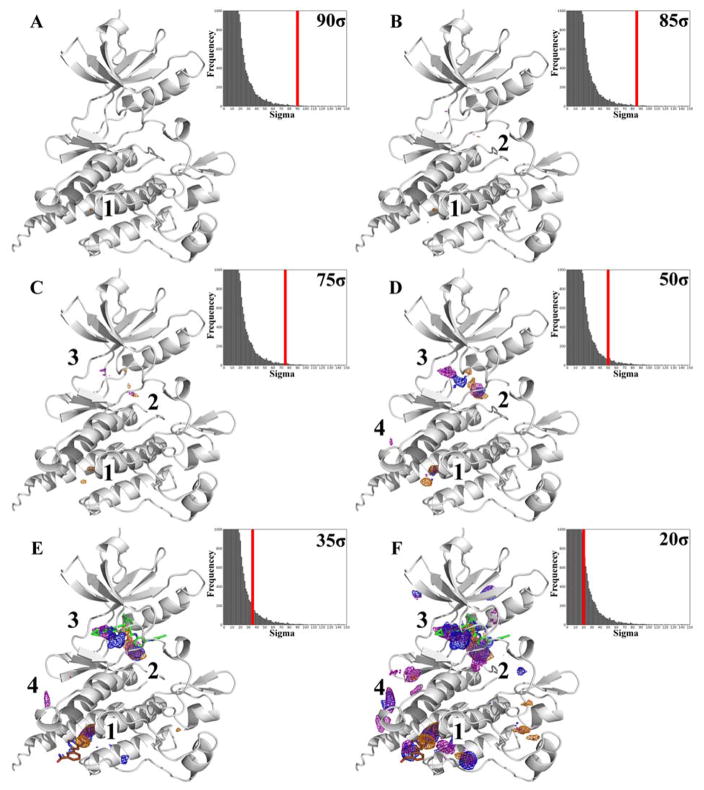
Figure 1.
The MixMD maps for ABL are contoured at varying sigma values from 90σ to 20σ to show the degree of molecular surface mapped by the probe atoms. The occupancy maps are color coded to represent MixMD results derived from different probes: acetonitrile (orange mesh), isopropanol (blue mesh), and pyrimidine (purple mesh). (A) At 90σ, the allosteric site shows the highest occupied points. (B) Maps contoured at 85σ, show a second hotspot in the active site. (C–F) When contouring the MixMD maps at successively lower sigma values, additional hotspots appear and are numbered based on their order of appearance. Unless sites are mapped by more than one probe type when contoured at 20σ they are ignored. The active site ligand (PDBid: 3KFA, green) and allosteric site ligand (PDBid: 3K5V, brown) are only shown for reference in E and F to orient the reader towards the location of the active and allosteric sites. We emphasize that no ligands were present in the MixMD simulations.

