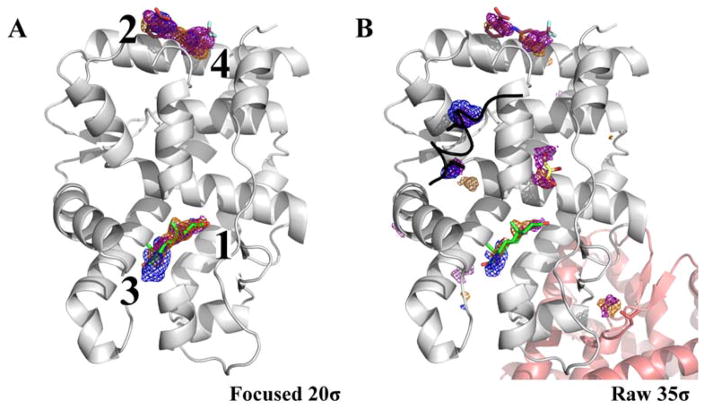
Figure 3.
(A) The location of just the top-four hotspots for the AR are shown contoured at 20σ: acetonitrile (orange), isopropanol (blue), and pyrimidine (purple). The active site ligand (PDBid: 2AM9, green) and the allosteric ligand (PDBid: 2PIX, brown) are shown for reference. A part of the α-helix obstructing the view has been hidden to provide a better view of the hotspots mapping the active site. (B) The MixMD maps are shown at 35σ that hotspots ranked five or lower correspond to crystal additives and packing contacts in other structures. Clearly, these are locations on the protein surface that can be desolvated and occupied. The different molecules are color coded as follows, Nuclear Receptor Co-Activator 2 in PDBid: 2QPY (black), glycerol in PDBid: 4HLW (yellow), and packing interface in PDBid: 2QPY (pink).

