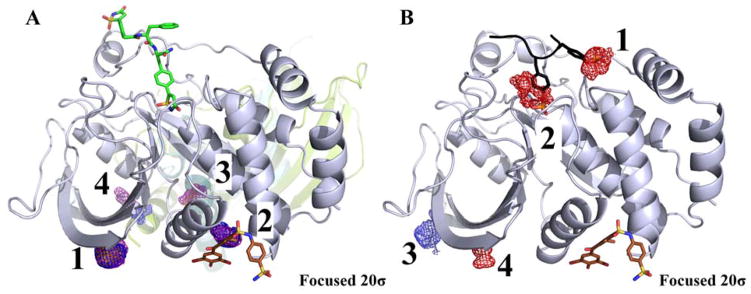
Figure 8.
(A) The location of the top-4 hotspots is shown for PTP1B. Maps for the organic probes are shown in mesh: acetonitrile (orange), isopropanol (blue), and pyrimidine (purple). The first hotspot maps the location of an additive seen in a crystal structure (PDBid: 3RWQ, pink but difficult to see in this view). The second hotspot maps the allosteric site (PDBid: 1T49, brown). Hotspot 3 is located near the packing interface PDBid: 2CMC (cyan). Hotspot 4 is located near the packing interface of PDBid: 4GRY. The raw 35σ structure is in the supplemental information. The active site ligand (PDBid: 2CMB, green) is shown for reference. (B) A MixMD simulation of acetate + methyl ammonium was carried out, and the top-four hotspots are shown contoured at 20σ. Acetate hotspots are in red mesh and methyl ammonium hotspots are in blue. A fragment of the substrate is overlaid on top of the protein (PDBid: 1G1F, black). The top-two ranked hotspots are from the acetate ion mapping both sites known to bind phosphorylated tyrosines.

