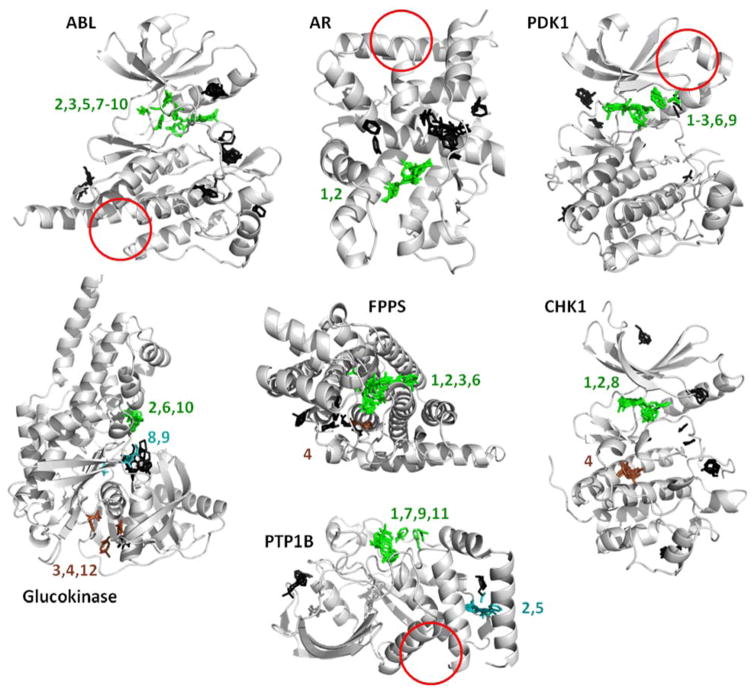
Figure 9.
These are the hotspots provided by the FTMap server, run on the same crystal structures we used to initiate the MixMD simulations (see Table 1). FTMap does well identifing all the active sites, but it does not detect the allosteric sites in half the systems (red circles). The view of the proteins is the same as the previous figures to allow the reader to compare the results. Hotspots are determined from clusters of probe molecules and ranked according to their average energy (cluster numbers are shown). Each cluster above is colored based on whether it overlaps with known ligands. Green indicates a cluster that overlaps with competitive ligands; brown clusters overlap allosteric ligands; black clusters do not overlap either binding site and their rank numbers are not shown. Cyan clusters in glucokinase overlap correct positions that were not mapped by MixMD. Cyan clusters in PTP1B map the site of a large crystallographic additive, which also was not mapped by MixMD. Please note that numbering in FTMap starts at zero, and we have shifted the numbers to start at one.

