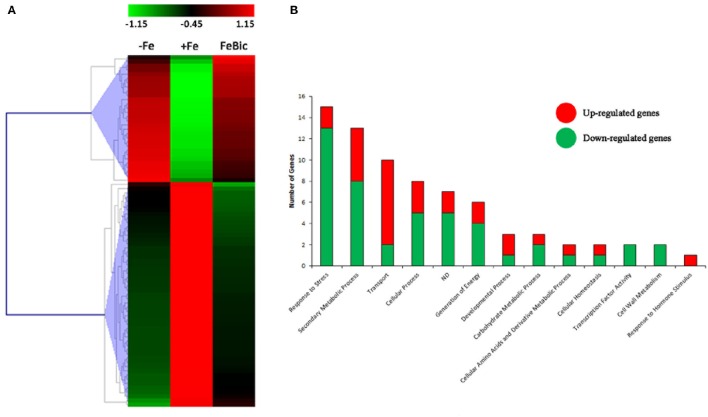
Figure 4.
Heat-map of −ig and FeBic common DEGs and their Gene ontology classification. (A) The mean unique-read values of DE genes identified in both −Fe and FeBic were graphically represented by mean of MeV software. Hierarchical clustering was performed using MeV HCL tool with the Pearson correlation coefficient. Up-regulated genes are indicated in red whereas down-regulated genes are colored in green. (B) Main gene ontology categories related to common DEGs according to VitisNet gene prediction update (Grimplet et al., 2012). For each category the contribute of up- (red) and down- (green) regulated genes is reported.

