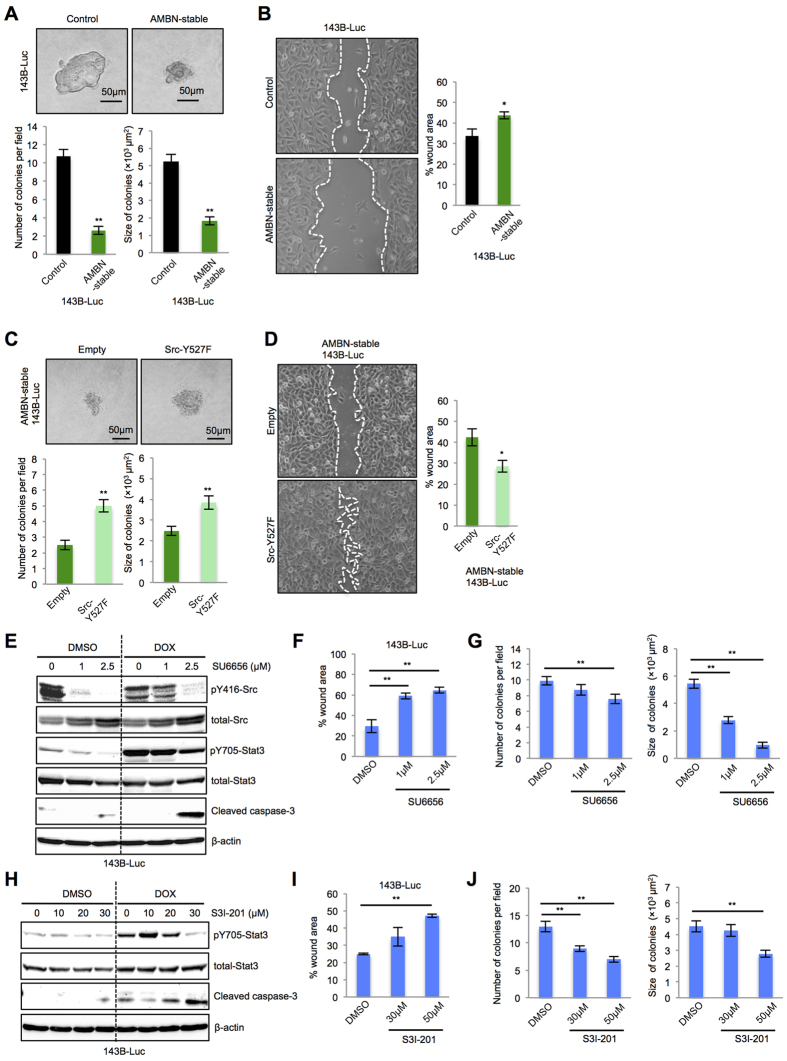
Figure 2. AMBN suppresses colony formation and cell migration through the Src-Stat3 pathway in osteosarcoma cells.
(A) Colony formation was assessed by soft-agar colony formation assay and representative colonies are shown (upper panels). Quantification of colony number and size is shown (lower graphs) (N = 20). (B) Cell migration activity was examined by wound healing assay. Representative images at 5 h are shown (left panels) and wound areas were quantified (right graph) (N = 3). Original magnification of the left panels: ×100. (C) Empty vector and Src-Y527F plasmid were transfected into AMBN-stable 143B-Luc cells, colony formation was assessed and representative colonies are shown (upper panels). Quantification of colony number and size is shown (lower graphs) (N = 20). (D) Cell migration activity was examined. Representative images at 5 h are shown (left panels) and wound areas were quantified (right graph) (N = 3). Original magnification of the left panels: ×100. (E) 143B-Luc cells were pretreated with SU6656 at indicated concentration for 24 h. The pretreated 143B-Luc cells were subsequently treated with DMSO or doxorubicin (0.5 μg/mL) for 24 h and the expression of pY416-Src, total-Src, pY705-Stat3, total-Stat3, and cleaved caspase-3 was examined. (F) Cell migration activity of pretreated 143B-Luc cells was examined. Wound areas at 5 h were quantified in the graphs (N = 3). (G) Colony formation in pretreated 143B-Luc cells was analyzed and representative colonies were shown (upper panels). Quantification of colony number and size was shown (lower panels) (N = 20). (H) 143B-Luc cells were pretreated with S3I-201 at indicated concentration for 24 h. The pretreated 143B-Luc cells were subsequently treated with doxorubicin (0.5 μg/mL) for 24 h and the expression of pY705-Stat3, total-Stat3 and cleaved caspase-3 was examined. (I) Cell migration activity of pretreated 143B-Luc cells was examined. Wound areas at 5 h were quantified in the graphs (N = 3). (J) Colony formation in pretreated 143B-Luc cells was analyzed and representative colonies were shown (upper panels). Quantification of colony number and size was shown (lower panels) (N = 20). Mean ± SEM (A–D,F,G,I,J); **P < 0.01; *P < 0.05.

