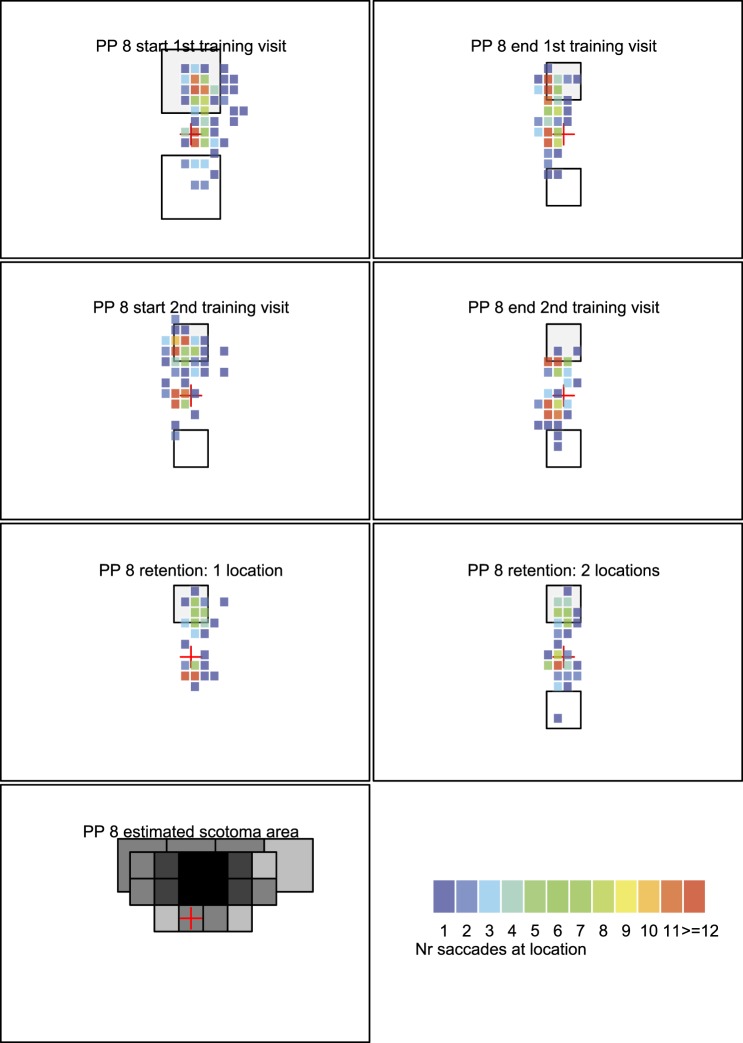
Figure 5A.
Heat map with fixation data from participant 8. Top row shows fixation locations on the first and last blocks of the first training session; the second row shows the first and last blocks of the second training session. The third row shows performance at retention for a block with only one stimulus (left) and with two stimuli (right). Bottom row shows the estimated binocular scotoma and the heat map legend showing the mapping of color to number of saccades.

