Figure 1.
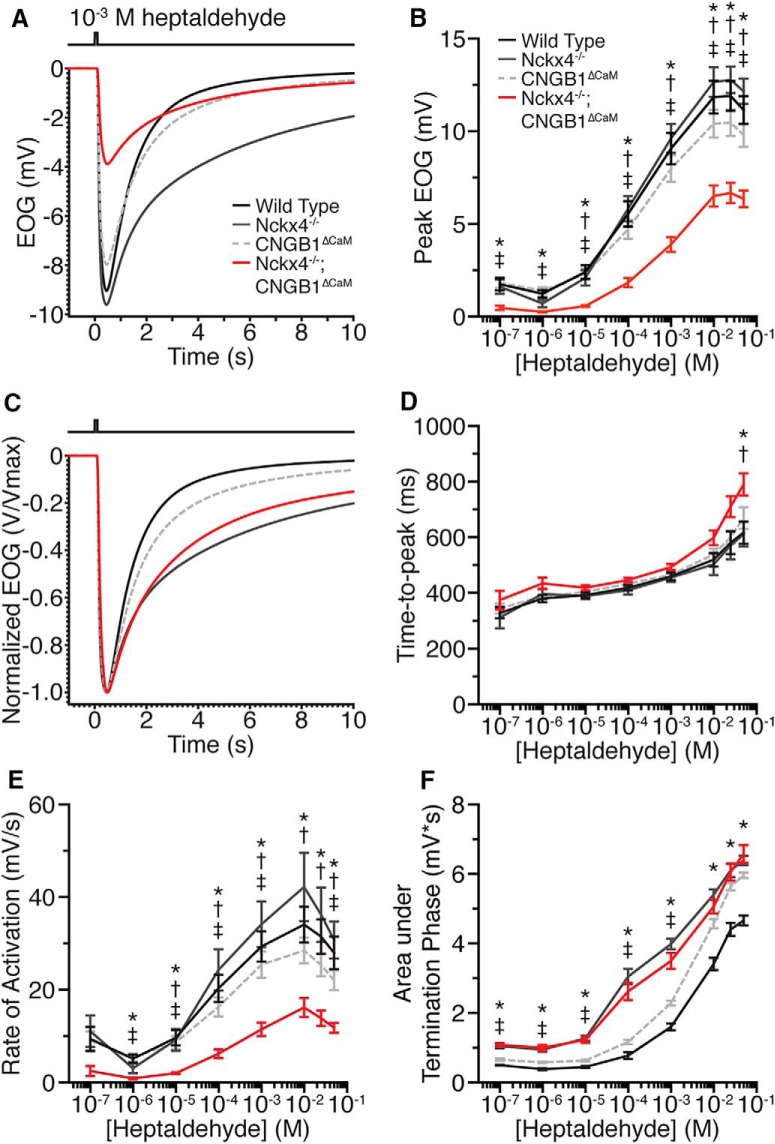
EOG responses to heptaldehyde in X4−/−;B1ΔCaM mice. A, EOG responses of WT, X4−/−, B1ΔCaM, and X4−/−;B1ΔCaM mice to a 100 ms pulse of 10−3 m heptaldehyde. Each trace represents an average of a single recording from multiple mice. Trace color codes also apply to B–F. B, Dose–response relationships of WT, X4−/−, B1ΔCaM, and X4−/−;B1ΔCaM mice EOG peaks evoked by single, 100 ms pulses of heptaldehyde. C, EOG responses from A, normalized relative to their peaks to allow for comparison of activation and termination kinetics. D, Time to peak, defined as the time from the initiation of the odorant pulse to the response peak. E, Activation rate, defined as the change in EOG amplitude divided by the time between 1% and 99% of the peak amplitude. F, Response termination, quantified as the area under the trace, after normalization of each response to its peak amplitude, in the termination phase of the response (see Materials and Methods). Error bars indicate SEM. Statistical significance was determined by one-way ANOVA followed by a Tukey's HSD post hoc test. *p < 0.05, WT versus X4−/−;B1ΔCaM. †p < 0.05, X4−/− versus X4−/−;B1ΔCaM. ‡p < 0.05, B1ΔCaM versus X4−/−;B1ΔCaM. N = 6, 5, 7, and 7 for WT, X4−/−, B1ΔCaM, and X4−/−;B1ΔCaM mice, respectively, and one recording per mouse per concentration.

