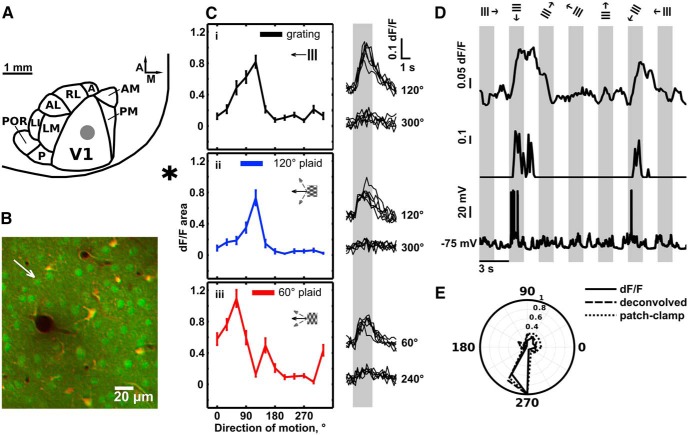
Figure 1.
Direction selectivity of pyramidal cells in mouse V1. A, Position of OGB injection and imaged area in the V1 of the left hemisphere. Typical range of dye injections is denoted by gray circle (2.5–3 mm lateral from midline, 1–1.5 mm anterior to transverse sinus). Position and average layout of area V1 and belt visual areas are adapted from Wang and Burkhalter (2007) and Marshel et al. (2011). A, Anterior; M, medial. We targeted injections to central V1. Star denotes the position of midline (medial) and the location of transverse sinus (posterior to V1). Scale bar, 1 mm. B, Typical in vivo two-photon image of L2/3 neurons in area V1. Green, OGB-filled cells; orange, astrocytes and Td-Tomato-expressing interneurons. White arrow denotes the cell body of the neuron from C. C, Example tuning curves (left) and responses (right) of the directionally selective pyramidal cell in response to drifting gratings and plaid patterns. We obtained tuning curves shown by calculating the mean area under the calcium transients evoked by stimuli with different directions of motion. Gray box in right panels signifies the stimulus presentation time. Ci, Tuning curve elicited by moving gratings. Right, Single-trial responses to the preferred stimulus (120°, top curves), and to a stimulus moving in the opposite direction (300°, bottom curves). Cii, Tuning curve (blue) elicited by a moving plaid with 120° CA. Right, Single-trial responses to the preferred plaid stimulus (120°), and a plaid stimulus moving in the opposite direction (300°, bottom curves). Ciii, Tuning curve (red) elicited by a moving plaid with 60° CA. Right, Single-trial responses to the preferred plaid stimulus (60°, top curves), and stimulus moving in the opposite direction (240°, bottom curves). Inset calibration: 0.1 (10%) dF/F, 1 s. Error bars: mean ± SEM. D, Deconvolution of calcium dF/F signals to compute relative firing rates (Vogelstein et al., 2010). Top, dF/F computed from OGB-1 signals. Middle, Corresponding deconvolved (Vogelstein et al., 2010) normalized mean firing rates. Bottom, corresponding current-clamp recording of spiking activity of the patched neuron. E, Tuning curves normalized to peak response, obtained from dF/F data (solid black line), current-clamp data (dotted black line) and deconvolved data (broken black line) from the cell in D. Note the high degree of correspondence between the tuning curves of each measure. The high correspondence between the OBG-based tuning curves and action potential-based tuning curves is expected, as calcium signals do not reach saturation for the range of recorded action potentials, which were generated in response to the stimuli that we used.

