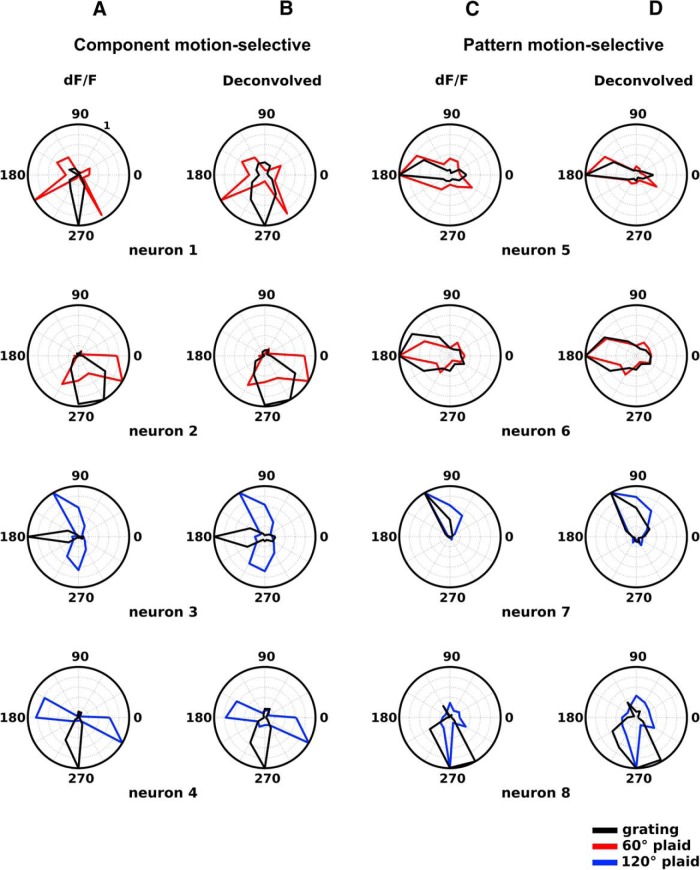
Figure 3.
Examples of component-motion-selective and pattern-motion-selective pyramidal cells: dF/F data vs deconvolved calcium data. A, B, CM-selective cells. C, D, PM-selective cells. A, C, Normalized tuning curves, obtained from dF/F calcium data. B, D, Normalized tuning curves, obtained from deconvolved calcium data. Note the close correspondence between tuning curves obtained from dF/F data and deconvolved data. Black, Tuning curves obtained with moving gratings; red, tuning curves obtained with 60° CA plaids; blue, tuning curves obtained with 120° CA plaids. Neurons 1–4 (A, B) are CM-selective. Note that the bilobed tuning curves generated by plaids have peaks offset from the direction of pattern motion by approximately half of the CA of the plaid (30° for neurons 1 and 2; 60° for neurons 3 and 4). Neurons 5–8 (C, D) are PM-selective and have unimodal direction of motion-tuning functions that match closely for gratings and for plaids.

