Figure 5.
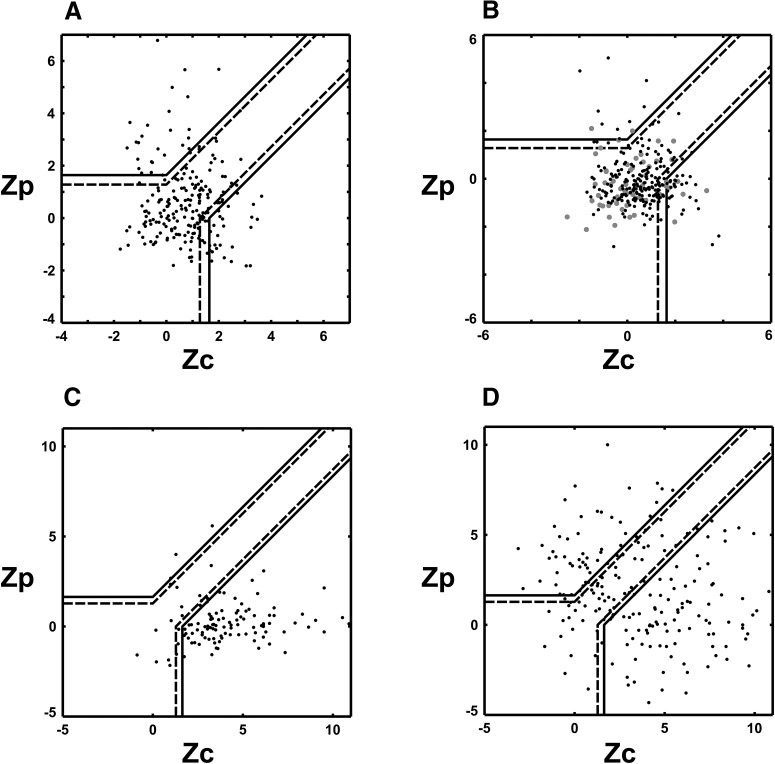
Component-motion and pattern-motion selectivity population results (z-scores). Scatter plot of component and pattern z-score coefficients calculated for each directionally selective L2/3 pyramidal neuron recorded in mouse V1. The x-axis plots the Zc value for each cell (see Materials and Methods). The y-axis displays the Zp value. Black line boundaries demarcate statistical significance levels calculated from the Fisher transform (see Materials and Methods; Smith et al., 2005): solid black line, p = 0.95; broken black line, p = 0.9. The p = 0.9 value has generally been used by previous investigators (Movshon and Newsome, 1996; Smith et al., 2005). A, Results from the 60° CA plaid, 232 cells pooled from six animals. All data were obtained with square-wave gratings and plaids (black dots). The corresponding plot of partial correlation coefficients is found in Figure 4A. B, Results from the 120° CA plaid. Data obtained with square-wave gratings and plaids are marked with black dots (225 cells pooled from six animals), sine-wave data are marked with gray dots (60 direction-selective cells pooled from two animals). The corresponding plot of partial correlation coefficients is found in Figure 4B. C, Literature results from cat and monkey V1 under anesthesia. Partial correlation data were digitized from the studies by Gizzi et al. (1990), Movshon and Newsome (1996), Guo et al. (2004), and Khawaja et al., 2009; and z-transform was applied to derive z-scores. Unlike mouse V1 and extrastriate areas of cats and primates, primate and cat V1 under anesthesia contains a large majority of CM-selective neurons with only a small minority of unclassified cells and only sporadic PM-selective cells. D, Aggregate population plot of direction-selective cells from cat and monkey extrastriate visual cortical areas and higher-order thalamic nuclei derived from the literature (MT, LS, and LP–pulvinar complex). Partial correlation data were digitized from the studies by Movshon et al. (1985), Gizzi et al. (1990), and Merabet et al. (1998); and were z-transformed to obtain associated z-scores. Note that the population in area V1 behaves more like extrastriate cat and monkey populations than like primate V1. Both primate extrastriate areas and mouse V1 contain large populations of unclassified direction-selective cells (primate extrastriate areas, ∼41%; mouse V1, ∼74%), while primate V1 contains a very small percentage of unclassified cells (∼16%) and most of the direction-selective primate V1 cells are CM-selective (∼84%). Thus, the shape of the distribution we observe in A and B from mouse V1 is more similar to the distributions observed in the extrastriate areas of cats and primates in its spread. The primate V1 distribution, in contrast, is narrowly centered in the CM-selective area of the plot (C).

