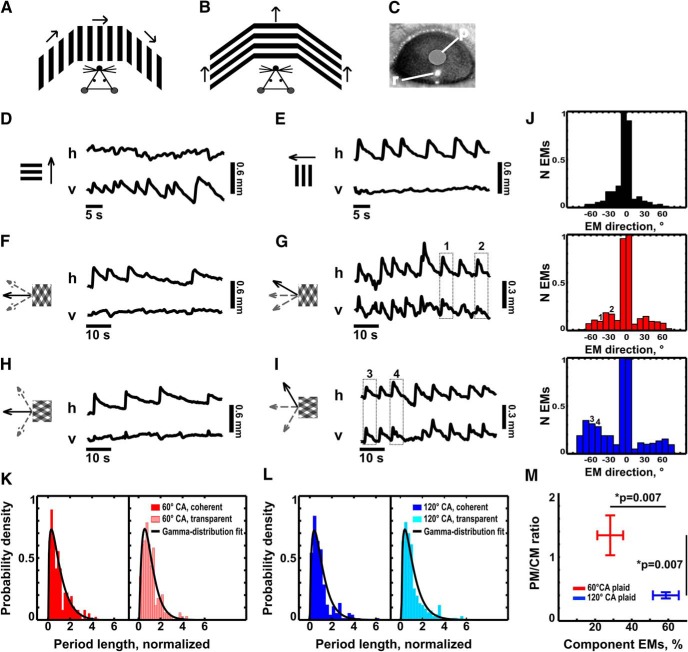
Figure 8.
Mice exhibit bistable OKN responses. A, B, Experimental setup. We presented the stimulus on three screens positioned at equal distances around the mouse head to cover ∼270° of the mouse visual field. We headposted the mouse to hold its head still and monitored EMs with an infrared camera (see Materials and Methods). Arrows, Direction of the drift of the stimulus. A, Setup for the recording of horizontal OKN. B, Setup for the recording of vertical OKN. C, Infrared image of a mouse eye. r, Reflection; p, pupil. D, Example of OKN elicited by a horizontally oriented grating drifting in the vertical direction (upward), as shown in B. v, Vertical eye position; h, horizontal eye position. As expected, OKN movements contain a clear vertical component, with no consistent horizontal deflections. E, Example of OKN elicited by a vertically oriented grating drifting in the horizontal direction, as shown in A. v, Vertical eye position; h, horizontal eye position. As expected, OKN movements contain solely a horizontal component, with no consistent vertical deflections. F, Example of OKN elicited by a 60° CA plaid whose global pattern is drifting in the horizontal direction. In this case, the eyes of the mouse follow the direction of motion of the global plaid pattern (horizontal), as is evident from the absence of a vertical OKN component. G, OKN elicited by the same 60° CA plaid as in F. In this case, the eyes of the mouse follow the direction of one of the component gratings of the plaid (the one moving toward 150°), as is evident from the combination of appropriate vertical and horizontal OKN movements. H, Example of OKN elicited by a 120° CA plaid whose global pattern is drifting in the horizontal direction. As in F, the mouse eye movements show purely horizontal OKN aligned with the direction of motion of the global plaid pattern. I, Example of component OKN, elicited by the same 120° CA plaid, as in H. In this case, the eye of the mouse follows one of the component gratings of the plaid (the one moving toward 120°). J, Normalized histograms of the direction of nystagmoid EMs elicited by gratings and plaid stimuli, which are expressed as offsets from the horizontal OKN elicited by the vertically moving grating described in C. Black histogram (top, data from eight animals), EMs elicited by the vertically oriented horizontally moving grating; red histogram (middle, data from eight animals), EMs elicited by the 60° CA plaid, whose global pattern is moving in the horizontal direction; blue histogram (bottom, data from 8 eight animals), EMs elicited by the 120° CA plaid, whose global pattern is moving in the horizontal direction. Note that, as the cross-angle of the plaid increases, the histogram becomes trimodal, with one peak corresponding to the pattern motion, and the other two peaks to motion of the components of the plaid. When there is only a grating stimulus (top) the directions of OKN are clustered tightly around 0° (mean ± SD = −3.2 ± 19.5°; median = 0). In contrast, for the 60° CA plaid a considerable fraction (∼28%) of nystagmoid EMs lie beyond 1 SD from the central peak (at 0°), corresponding to OKN elicited by either one or the other of the plaid components. For the 120° CA plaid, component perception becomes more pronounced as ∼58% of nystagmoid EMs belong to the secondary modes (±1 SD from the central peak at 0°). These modes have peaks at 49 ± 17.9° and −54.5 ± 15.7° (mean ± SD), respectively, approximately corresponding to the directions of drift of the 120° CA components of the plaid. K, Distribution of durations of the periods of coherent (red histogram) versus transparent (pale-red histogram) motion perception induced by the 60° plaid (eight mice; 175 transparent periods and 181 coherent periods). Before pooling, the dataset of each animal was normalized by its mean duration. Coherent, Red; transparent, pale red. The distributions were fit with gamma distribution (coherent, p = 0.017; transparent, p = 0.031; χ2 test). L, Distribution of durations of the periods of coherent (blue histogram) vs transparent (cyan histogram) motion perception induced by the 120° plaid (eight mice; 264 transparent periods and 258 coherent periods). Before pooling, the dataset of each animal was normalized by its mean duration. Coherent, Blue; transparent, cyan. The distributions were fit with gamma distribution (coherent, p = 0.000018; transparent, p = 0.00005; χ2 test). M, The increase in angle between the plaid components correlates with an increase in the relative fraction of transparent OKN, and with a shift in the ratio between PM-selective and CM-selective neuronal responses in favor of CM-selectivity. Error bars represent the SEM. Red, 60° CA plaid data; blue, 120° CA plaid data. Two-photon data, n = 6 animals; EM analysis, n = 8 animals. Significance testing across animals: Wilcoxon rank-sum test: p = 0.007 for PM/CM ratio shift and component EM fraction change.

