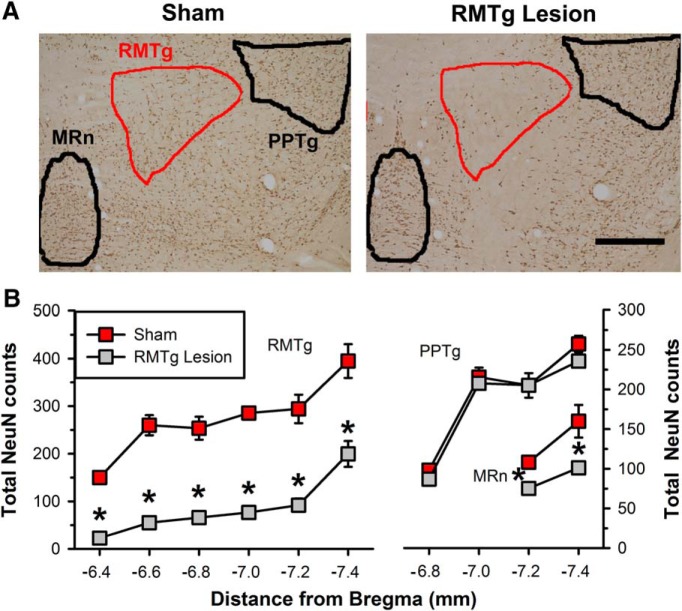
Figure 2.
Neuronal loss in the mesopontine tegmentum after QA injection. A, Representative photomicrographs of a sham-treated (left) and RMTg-lesioned (right) rat midbrain (∼−7.2 mm caudal to bregma) immunostained for NeuN with overlaid boundaries of the RMTg (red), MRn, and PPTg (black). Scale bar, 0.4 mm. B, Total NeuN-positive cell counts (mean ± SEM) within the boundaries of the RMTg, MRn, and PPTg by distance to bregma for sham (red squares, n = 4 all areas) and RMTg-lesioned (gray squares, n = 16 RMTg, n = 19 MRn and PPTg) rats. NeuN cell counts after lesion were significantly reduced in both the RMTg and MRn both overall (see text) and at each AP coordinate relative to sham-treated rats. *p < 0.05, Fisher's test.

