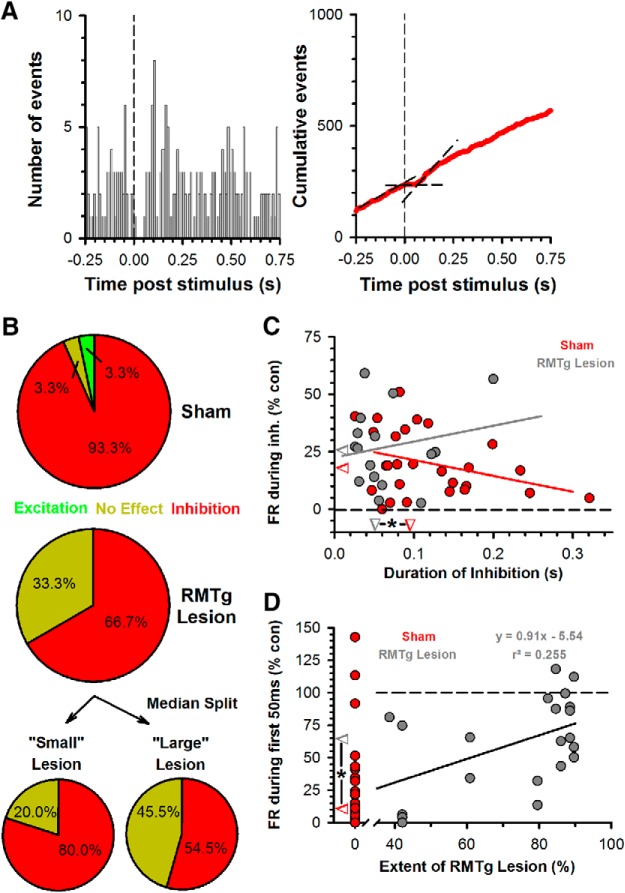
Figure 4.
Effects of RMTg lesions on the response of DA neurons to LHb stimulation. A, Example of a peristimulus time histogram (left) and CUMSUM plot (right) from a DA neuron initially inhibited by LHb stimulation (vertical dashed line) in an RMTg-lesioned rat. Note the shorter duration of inhibition compared with the sham control example in Figure 1. B, Pie charts illustrating the prevalence of neurons exhibiting excitation, no effect, or inhibition in response to LHb stimulation in sham-operated (top) and RMTg-lesioned (middle) rats. A median split by lesion size of the RMTg-lesioned group is also shown (bottom; see text for details). C, Scatterplot of the duration of inhibition (abscissa) versus the magnitude of inhibition expressed as a percentage of control firing rate (ordinate) for neurons inhibited by LHb stimulation in sham (red, n = 28) and RMTg-lesioned (gray, n = 16) rats. Straight lines represent regression lines for the sham (red; Pearson's r(26) = −0.34, p = 0.077) and RMTg-lesioned (gray; Pearson's r(14) = 0.19, p = 0.481) groups. Median values for both groups are demarcated on the axes by correspondingly colored triangles. Note that RMTg-lesioned rats had a significantly shorter duration of inhibition overall (*, see text). Although the slopes have a different valence, they are not significantly different (t(40) = −1.53, p = 0.134). D, Scatterplot for RMTg-lesioned rats (gray) illustrating the percentage of neuronal loss in lesioned rats (abscissa) versus the percentage change in firing rate for the first 50 ms after LHb stimulation relative to baseline (ordinate). Sham rats (red) are shown at zero percentage for comparison. Median values for both groups are demarcated on the ordinate by correspondingly colored triangles and were significantly different (*, see text). A significant linear trend was present among RMTg-lesioned rats, with the percentage of neurons lost to the lesion correlating with a decrease in LHb-stimulation induced inhibition. Note that, in rats with the greatest lesion-induced cell loss, some cells showed a slight excitation in response to LHb stimulation. Only rats with fully quantified lesions were included in this analysis.

