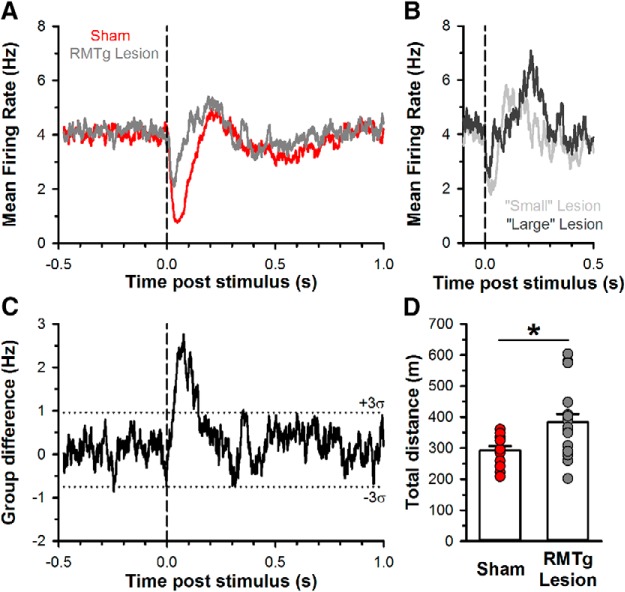
Figure 5.
Effect of RMTg lesions on both mean firing rate of all sampled DA neurons in response to LHb stimulation and open-field activity. A, Average peristimulus time histogram of firing rate for all DA neurons in both sham (red) and RMTg lesioned (gray) rats using 1 ms bins with a 25 bin exponential weighted moving average (see Materials and Methods for details). After LHb stimulation (vertical dashed line), DA neurons from RMTg-lesioned rats displayed an attenuated inhibition relative to sham rats. B, Average peristimulus time histogram of firing rate for all DA neurons in RMTg-lesioned rats using a median split by lesion size to form small (light gray) and large (dark gray) lesion groups. The average duration of inhibition appears to be shorter in the larger lesion group compared with the small lesion group, likely reflecting the trend for more neurons in the large lesion group to show no response to LHb stimulation. C, Difference in firing rate between groups from Figure 5A. SD of the delta scores was calculated from the baseline period preceding LHb stimulation (vertical dashed line); horizontal dotted lines represent a 3 σ deviation from the mean delta score. D, Bar graph of mean total distance traveled in an open field overlaid with individual scores from sham (n = 13, red) and RMTg-lesioned (n = 18, gray) rats. *p < 0.05, t test. Note that all sham data points are lower than the mean value for the RMTg-lesioned group.

