
Figure 1.
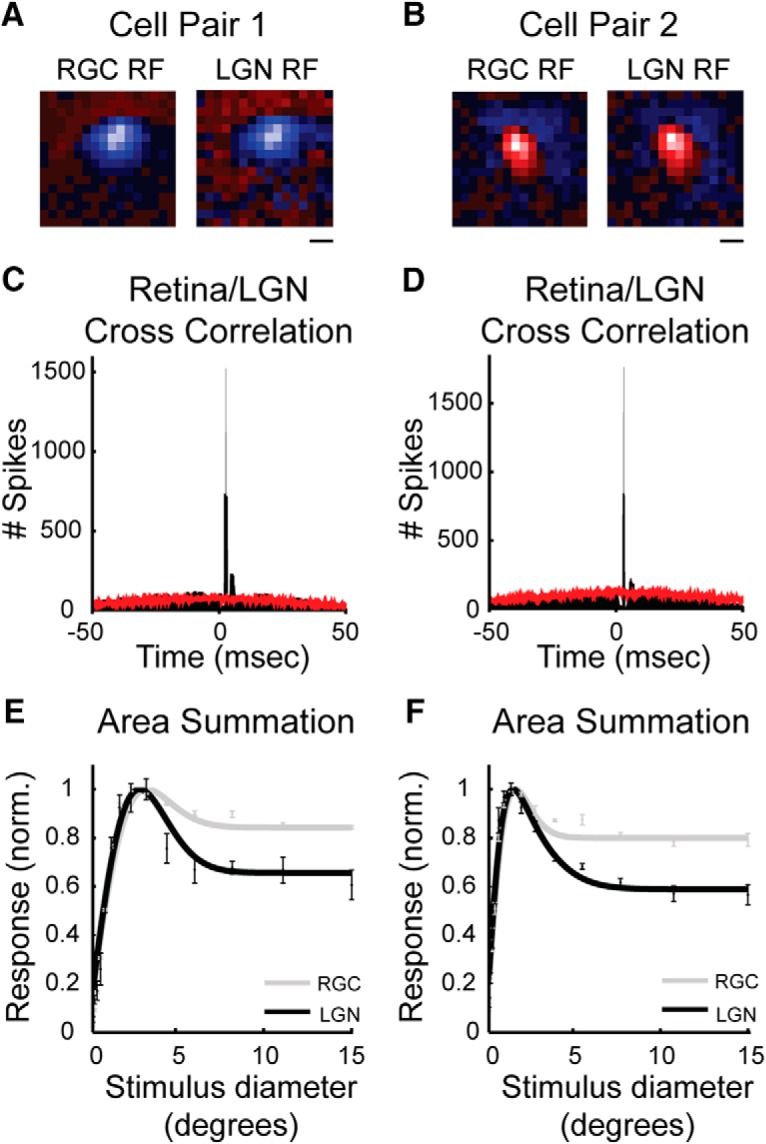
Receptive fields, cross-correlograms, and area summation response functions for two pairs of simultaneously recorded RGCs and LGN neurons that met the criteria for a monosynaptic connection. A, B, White noise receptive field maps on an off-center pair of cells (A) and an on-center pair of cells (B). In both cases, receptive fields are extremely similar in their size and spatial location. In each receptive field map, red codes for on responses and blue for off responses; pixel brightness indicates the strength of response. Scale bar indicates 1° of visual angle. C, D, Cross-correlograms showing the relationship in spiking activity between the cells shown in A and B during visual stimulation with a drifting sinusoidal grating (see Materials and Methods). Retinal spikes are set to time 0 and data points show the occurrence of LGN responses relative to retinal spikes. Unshuffled and shuffled correlations are indicated in black and red, respectively. The abrupt, short latency peaks in the unshuffled cross-correlograms that rise above the shuffled correlogram indicates that the LGN neurons often fired a spike in response to a retinal spike. E, F, Area summation response functions corresponding to the same pair of cells shown in the overlying panels. Cells were excited with expanding patches of drifting gratings (see Materials and Methods). For both pair of cells, the LGN neuron (black trace) shows greater extraclassical suppression to large stimuli than the does the simultaneously recorded RGC (gray trace). Error bars indicate SEM.