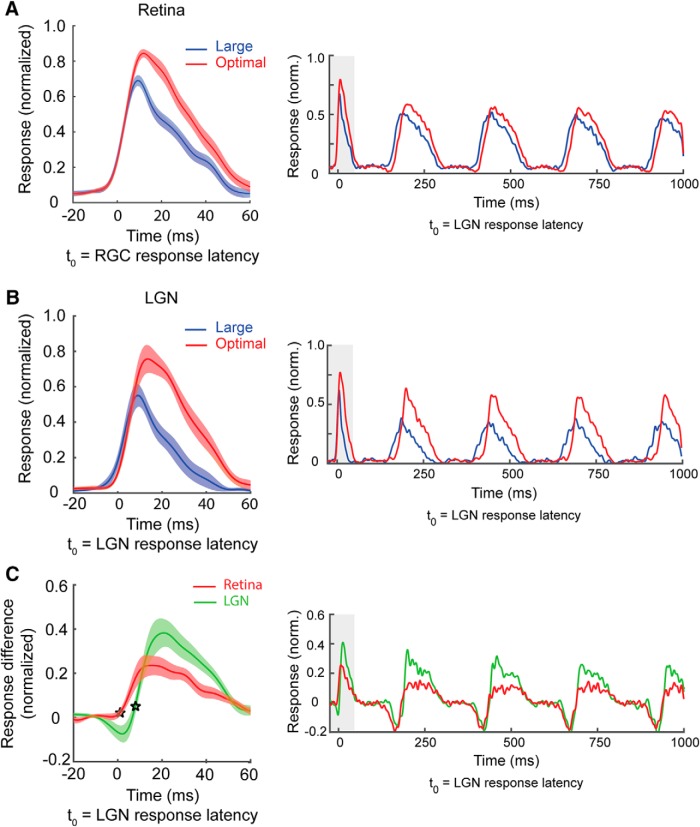
Figure 6.
Extraclassical suppression emerges early in retinal and geniculate responses. A, Population RGC temporal response profile calculated from the first cycle of a 4 Hz drifting sine-wave grating (starting phase set to each cell's preferred phase). Red curve shows the time course of responses to an optimal size grating stimulus; blue curve shows the time course of responses to a large grating stimulus. The timing of responses is shown relative to t(0), which is the response latency of the RGCs when stimulated with an optimal size stimulus. RGC response latency was calculated separately for each cell. Shaded area corresponds to 95% confidence intervals. B, Population LGN temporal response profile (details the same as in A). t(0) is the LGN response latency of the LGN cells to an optimal size stimulus. C, Difference curves (optimal − large) for the RGCs (red) and LGN neurons (green). Stars indicate the suppression latencies for the RGCs and LGN neurons. t(0) is the LGN response latency for optimal size stimuli.

