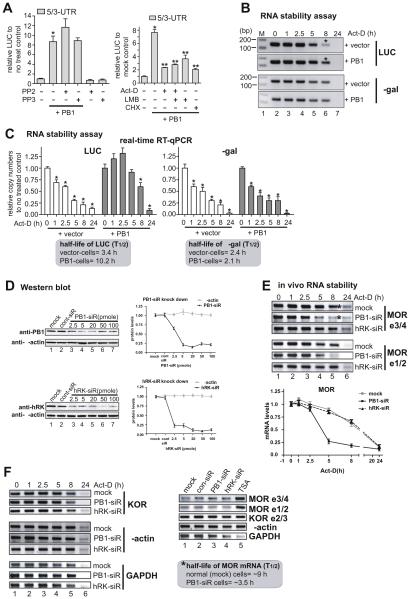
Fig. 3.
Induction of MOR mRNA stability by PCBP1. A) PCBP1-mediated upregulation was examined in MOR UTR constructs by LUC assay with an inhibitor of c-Src family kinases, PP2, along with its inactive control PP3 (left graph), and inhibitors of transcription, actinomycin-D (Act-D), translation cycloheximide (CHX), and nuclear export leptomycin-B (LMB) (right graph). *P < 0.05 vs. control; **P < 0.05 vs. non-treated PB1-transfectant. B) mRNA stability of LUC analyzed by RT-PCR. C) mRNA stability of LUC analyzed by real-time RT-qPCR. Primer sets LUC-S1 and LUC-AS1 were used for luciferase transcript and set Gal-S1 and Gal-AS1 for β-galactosidase transcript from the cotransfected internal control. Asterisks in B indicate the major bands that differ between vector control and PB1-transfectant. *P < 0.05 vs. control (C). D) Protein levels of PCBP1 (PB1, upper gel image) and hnRNPK (hRK, lower gel image). Indicated amounts of siRNAs of PB1 and hRK were transfected into P19 cells, and the protein levels of the cells were analyzed in Western blots using the respective antibodies. Anti-β-actin was used as a gelloading control. Quantitative analyses of the Western blot results are shown on the right side. E) In vivo mRNA stability of MOR is decreased in PCBP1-knockdown cells. In vivo mRNA stability of MOR was examined by RT-PCR with two sets of MOR-specific PCR primers: MOR e3/4 primers [mMOR_E3-S and mMOR_E4-AS, (Hwang et al., 2007)] covering MOR exons 3 and 4, and MOR e1/2 primers (mMOR-S7 and mMOR-AS7, Table 1) covering exon 1 and 2. Asterisks indicate the major band that differs between control siRNA- and PB1 siRNA-transfectant (PB1-siR) cells. hnRNPK siRNA (hRK-siR) was used as a control for the subfamily member of PCBP1. The lower panel shows the quantitative difference in the bands after averaging results obtained from RT-PCRs with two MOR primer sets (MOR e3/4 and MOR e1/2). F) Other genes were examined in the knockdown cells by RT-PCR. PCR primers for KOR (Kim et al., 2011), β-actin (Hwang et al., 2007), and GAPDH (Smirnov et al., 2001) were used as described previously. In panels E and F, MOR in P19 cells was stimulated by TSA as described previously (Hwang et al., 2007) before the RNA stability assay was done. siRNA did not change the expression levels of genes tested in the non-TSA-stimulated cells except for the GAPDH gene. The half-life (T½) of the MOR transcript is shown in the box in F. These results are representative of three different experiments.

