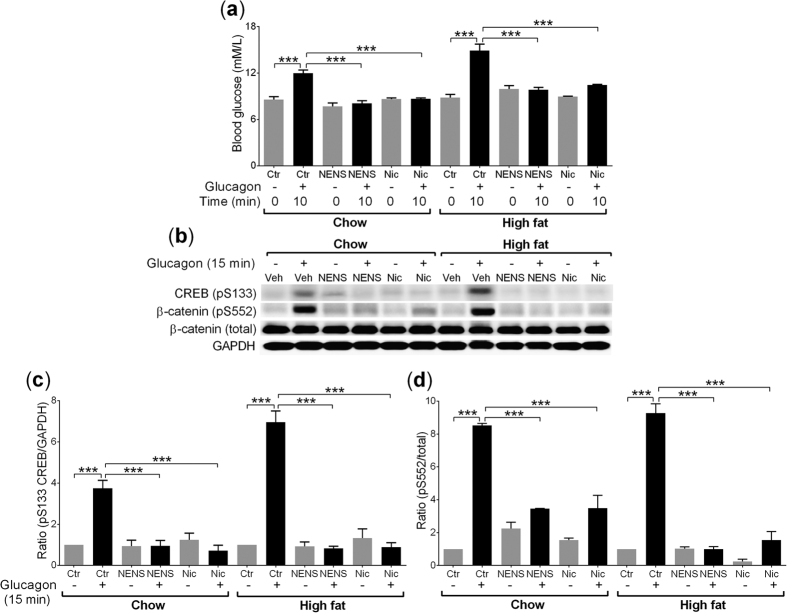
Figure 5. Both NENS and Nic block glucagon induced Ser133 (CREB) and Ser552 (β-catenin) phosphorylation on chow or high fat diets, leading to reduced hepatic glucose output, a downstream marker of PKA inhibition.
(a) Blood glucose levels following glucagon exposure, non-fasted mice (8 am) were injected with glucagon i.p. and blood glucose measured at time 0 and 10 minutes, before rapid tissue collection. (b) A representative western blot image after 15 minutes of glucagon (1.15 nM) exposure on Ser133 (CREB) and Ser552 (β-catenin) phosphorylation from the liver. (c) Quantification of western blots for pSer133/GAPDH (CREB) and (d) pSer552/total (β-catenin). n = 6 per group. Statistical significance (P) was determined by multiple comparisons Two-way ANOVA test. The data is showed as the mean ± S.E.M. ***p < 0.001 compared to the control (Ctr) chow or control (Ctr) high fat mice.

