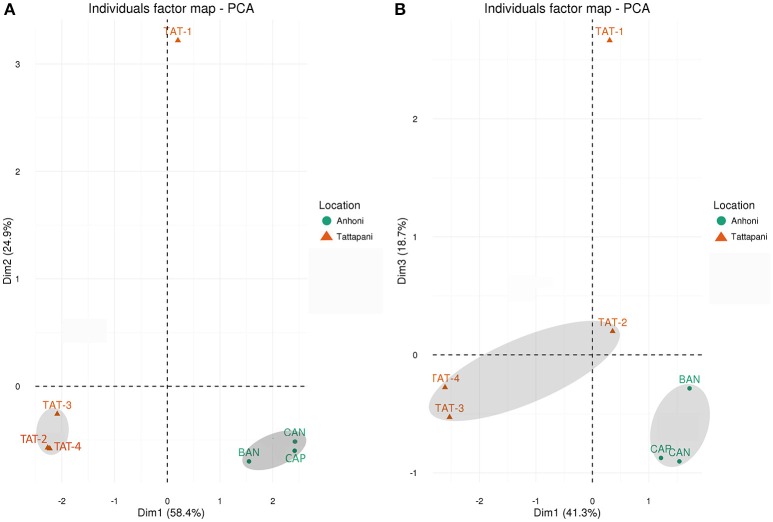
Figure 1.
PCA plots based on 16S rRNA and WGS reads. (A) Unweighted UniFrac distances calculated using amplicon reads and plotted on PCA plot. (B) Hellinger distances calculated using KO abundances from metagenomic reads and plotted on PCA plot. All Anhoni samples clustered together, whereas the TAT-1 was found distant from other Tattapani samples.

