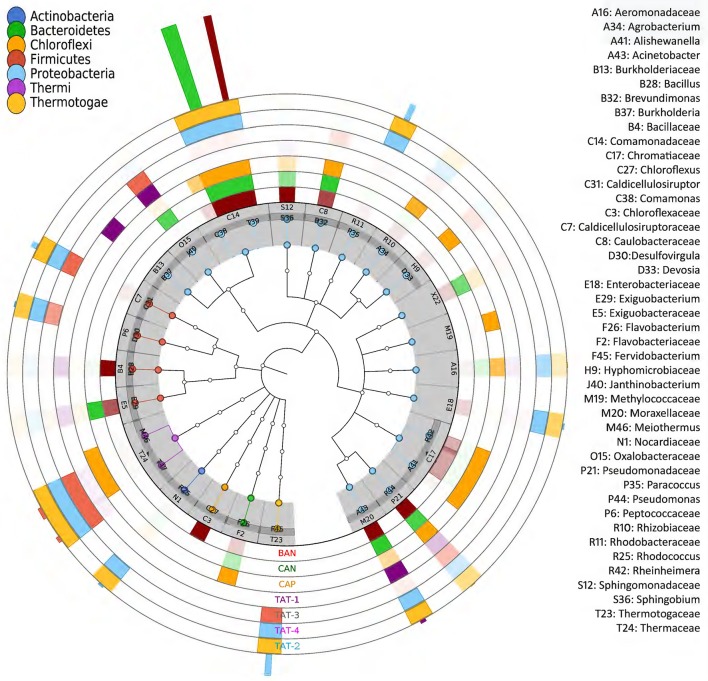
Figure 3.
Taxonomic tree showing microbial community structure in hot spring samples. The families having ≥ 1% abundance are plotted. The outer seven concentric circles depict a heatmap based on the taxonomic abundances in different samples. The color of outermost bars depicts the sample in which the taxonomic group is abundant. The color in the inner nodes depicts its phylum.

